Market Wrap: Stocks, Bonds, Commodities
US stocks ended solidly lower on Thursday, with shares of Tesla falling after its results and Treasury yields surging as Federal Reserve Chair Jerome Powell spoke about monetary policy and investors worried whether interest rates would stay higher for longer.
The Dow Jones Industrial Average fell 250.91 points to 33,414.17, the S&P 500 lose 0.85% to 4,278.00 and the Nasdaq Composite subtract 128.13 points to 13,186.17.
MSCI’s index of Asia-Pacific stocks outside Japan is decline 0.49% to 589.34 levels. The Australian index was lower by 1.16% to 6,900.70. Japanese Nikkei Index drop 0.52% today.
European stocks were negative on Friday, with the Stoxx Europe 50 Index fell 0.75% to 4,059.85, Germany’s DAX drop 0.87% to 14,914.85, and France’s CAC decline 0.77% to 6,867.87 and U.K.’s FTSE 100 subtract 0.29% to 7,477.47.
Benchmark 10-year U.S. Treasury fell as demand for safe assets ascend again, today 10-year bond yields negative 0.82% to 4.9500.
Oil prices extended gains on Friday and were on track to rise for a second week on heightened fears that the Israel-Gaza crisis may spread in the Middle East and disrupt supply from one of the world’s top-producing regions.
Spot Brent crude oil ascend 1.36% to $93.66 per barrel. US West Texas Intermediate crude is up 1.53% to $89.70 a barrel.
The yellow metal gold is advance 0.76% to 1,995.55 dollars per ounce.
Market Wrap: Forex
The dollar held firm against major currencies on Thursday and gained against more volatile ones, underpinned by the U.S. 10-year yield nearing the 5% level and before remarks by Federal Reserve Chair Jerome Powell at a discussion on the economy.
Today, the U.S. dollar index measures the Greenback against a trade-weighted basket of six major currencies, which slipped 0.01% to 106.020.
The Euro US Dollar (EUR/USD) is a widely traded pair that is up 0.11% today. This left the pair trading around $1.05900.
The Japanese yen was negative against the U.S. dollar on Friday. Today USD/JPY is surged 0.13% to the 149.950 level.
Another commodity-related currency negative against the U.S dollar, AUD/USD fell 0.20% to 0.63160, and NZD/USD slipped 0.21% to 0.58350 level.
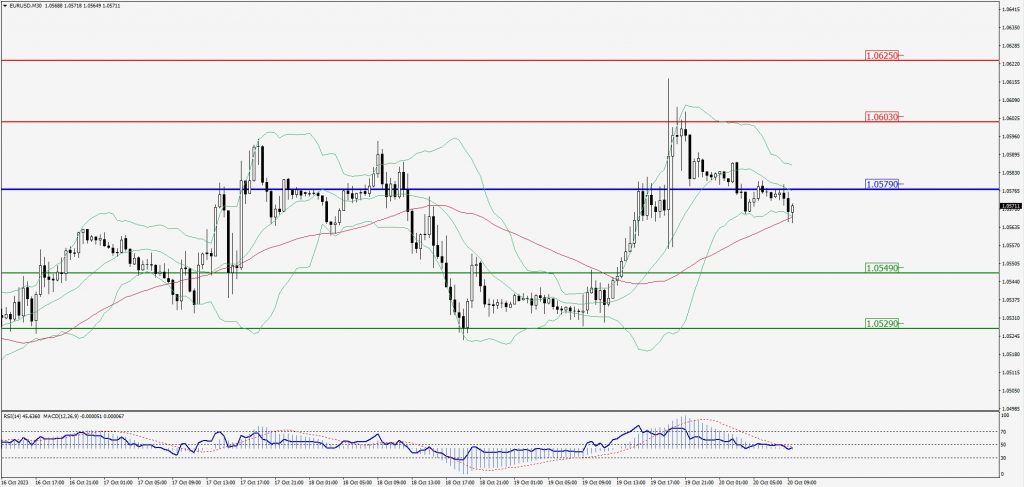
EUR/USD Intraday: Trend on the downside
Our pivot point is at 1.05790
Preferable Price Action: Take sell positions below pivot level with targets at 1.05490 & 1.05290 in extension.
Alternative Price Action: Above pivot looks for a further upside to 1.06030 & 1.06250.
Comment: RSI is below 50 levels and Pairs below 20MA.
Green Lines Indicate Resistance Levels – Red Lines Indicate Support Levels
Light Blue is a Pivot Point – Black represents the price when the report was produced
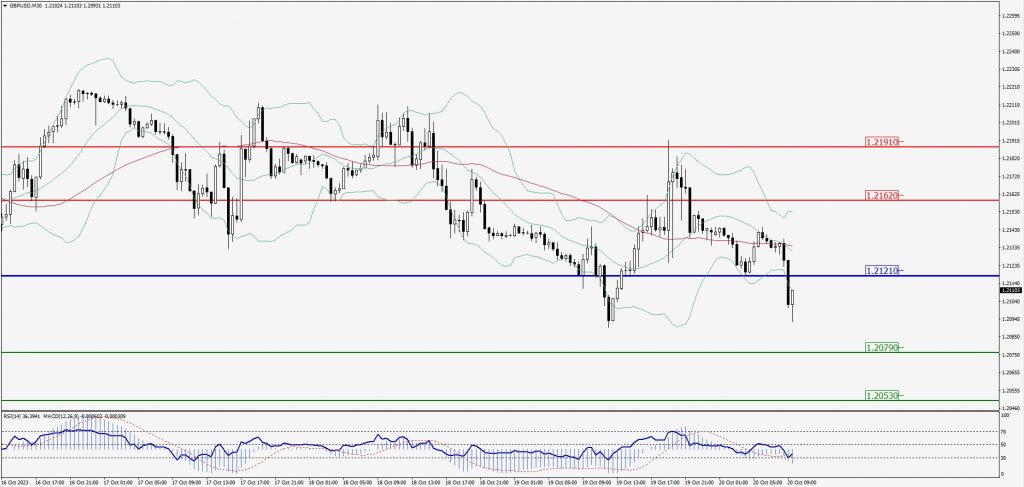
GBP/USD Intraday: Major trend on the downside
Our pivot point is at 1.21210
Preferable Price Action: Sell positions below pivot with targets at 1.20790 & 1.20530 in extension.
Alternative Price Action: The price above pivot would call for further upside to 1.21620 & 1.21910.
Comment: RSI is below 50 levels and Pairs below its 20MA & 55MA.
Green Lines Indicate Resistance Levels – Red Lines Indicate Support Levels
Light Blue is a Pivot Point – Black represents the price when the report was produced
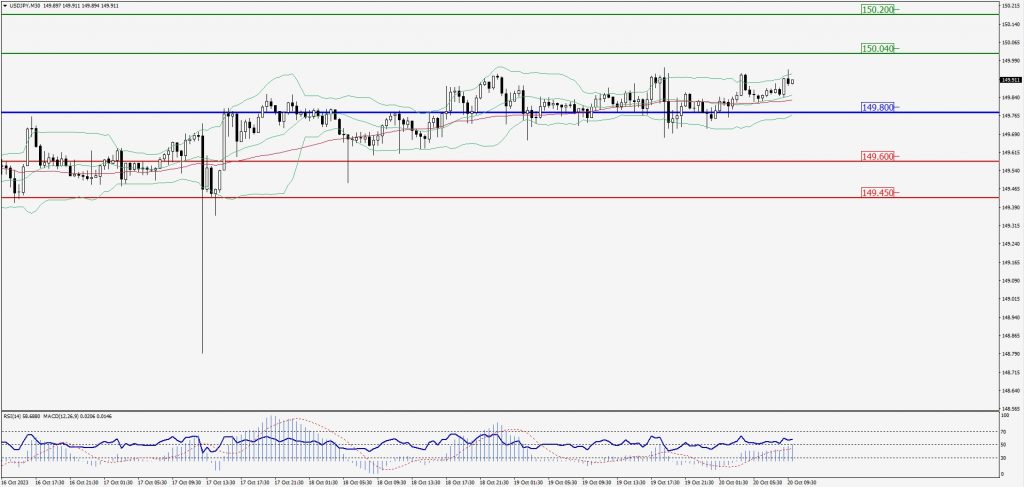
USD/JPY Intraday: Support level at 149.800
Our pivot point is at 149.800
Preferable Price Action: Buy position above pivot with the target at 150.040 and 150.200 in extension.
Alternative Price Action: The downside breakout of the pivot would call for 149.600 and 149.450.
Comment: MACD is above 50 level and Pairs above its 20MA & 55MA.
Green Lines Indicate Resistance Levels – Red Lines Indicate Support Levels
Light Blue is a Pivot Point – Black represents the price when the report was produced
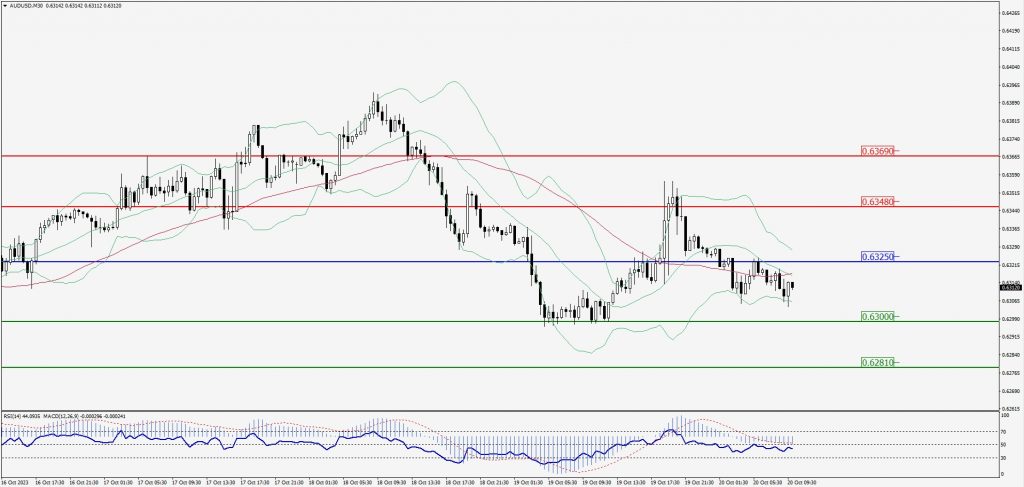
AUD/USD Intraday: Trend on the downside
Our pivot point is at 0.63250
Preferable Price Action: Sell positions below pivot with targets at 0.63000 & 0.62810 in extension.
Alternative Price Action: Above pivot looks for a further upside with 0.63480 & 0.63690 as targets.
Comment: RSI is below 50 levels and Pairs below its 20MA & 55MA.
Green Lines Indicate Resistance Levels – Red Lines Indicate Support Levels
Light Blue is a Pivot Point – Black represents the price when the report was produced
CRUDEOIL Intraday: Trend on the upside
Our pivot point is at 88.62
Preferable Price Action: Above pivot buy oil with 89.82 & 90.53 as targets.
Alternative Price Action: Sell crude below pivot with targets at 87.70 and 87.09 in extension.
Comment: MACD is positive territory and Pairs above 55MA.
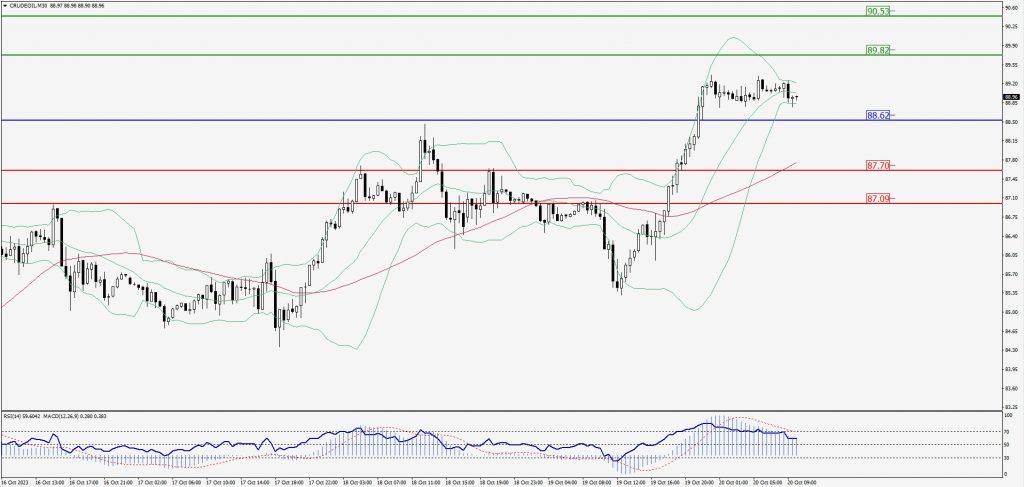
Green Lines Indicate Resistance Levels – Red Lines Indicate Support Levels
Light Blue is a Pivot Point – Black represents the price when the report was produced
XAU/USD Intraday: Trend on the upside
Our pivot point is 1973.70
Preferable Price Action: Further upside to 1990.60 and 2001.90.
Alternative Price Action: If the price gives a downside breakout of a pivot, then the price extends to 1959.90 and 1949.70.
Comment: MACD is above 50 level and Pairs above its 20MA & 55MA.
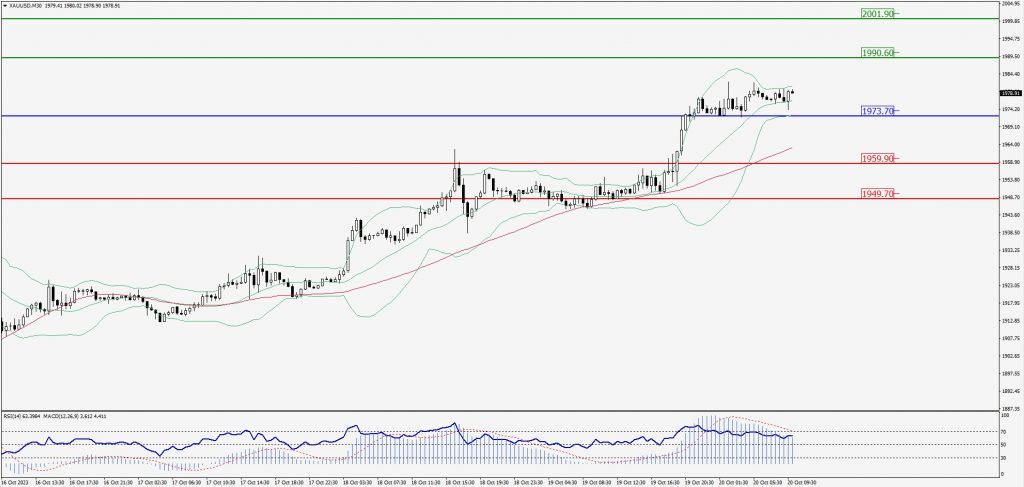
Green Lines Indicate Resistance Levels – Red Lines Indicate Support Levels
Light Blue is a Pivot Point – Black represents the price when the report was produced
Dow Jones Intraday: Trend on the downside
Our pivot point is 33,427.00
Preferable Price Action: Take sell positions below the pivot with targets at 33,214.00 & 33,092.00.
Alternative Price Action: Above 33,427.00 looks for further upside to 33,607.00 & 33,754.00.
Comment: RSI is below 50 levels and Pairs below its 20MA & 55MA.
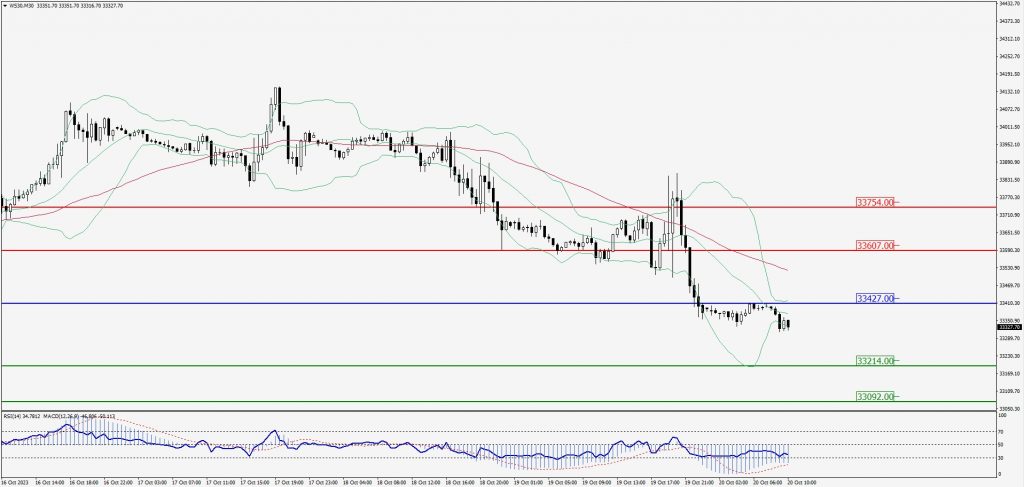
Green Lines Indicate Resistance Levels – Red Lines Indicate Support Levels
Light Blue is a Pivot Point – Black represents the price when the report was produced