Market Wrap: Stocks, Bonds, Commodities
The dollar eased slightly on Monday as investors gauged the implications of U.S. President Joe Biden’s decision to end his re-election campaign and clear the way for another Democrat to challenge Donald Trump.
The Dow Jones Industrial Average fell 377.49 points to 40,287.53, the S&P 500 loss 0.71% to 5,505.00 and the Nasdaq Composite descend 144.28 points to 17,726.94.
MSCI’s index of Asia-Pacific stocks outside Japan is down 0.56% to 691.96 levels. The Australian index was lower by 0.50% to 7,931.70. Japanese Nikkei Index decrease 1.28% today.
European stocks were mixed on Monday, with the Stoxx Europe 50 Index increase 0.47% to 4,850.00, Germany’s DAX ascend 0.43% to 18,243.15, and France’s CAC higher 0.50% to 7,572.01 and U.K.’s FTSE 100 loss 0.53% to 8,199.10.
Benchmark 10-year U.S. Treasury rose as demand for safe assets slipped again, today 10-year bond yields decrease 0.73% to 4.2080.
Oil prices rose in Asian trade on Monday, recovering some measure of recent losses on hopes of improving economic conditions in top importer China after the country unexpectedly lowered borrowing costs.
Spot Brent crude oil increase 0.54% to $83.08 per barrel. US West Texas Intermediate crude is increase 0.48% to $79.02 a barrel.
The yellow metal gold is up 0.28% to 2,405.90 dollars per ounce.
Market Wrap: Forex
Most Asian currencies tread water on Monday as an unexpected interest rate cut in China offered little cheer, while the dollar crept lower after President Joe Biden said he will no longer seek reelection.
Today, the U.S. dollar index measures the Greenback against a trade-weighted basket of six major currencies, which decrease 0.12% to 103.9900.
The Euro US Dollar (EUR/USD) is a widely traded pair that is ascend 0.06% today. This left the pair trading around $1.08830.
The Japanese yen was will move negative against the U.S. dollar on Monday. Today USD/JPY is trades pair that decrease 0.64% to the 156.470 level.
Another commodity-related currency negative against the U.S dollar, AUD/USD fell 0.25% to 0.66650, and NZD/USD decrease 0.22% to 0.59960 level.
EUR/USD Intraday: Trend on the downside
Our pivot point is at 1.08890
Preferable Price Action: Take sell positions below pivot level with targets at 1.08790 & 1.08710 in extension.
Alternative Price Action: Buy pivot looks for a further upside to 1.08980 & 1.09070.
Comment: RSI is below 50 levels and Pairs below its 20MA.
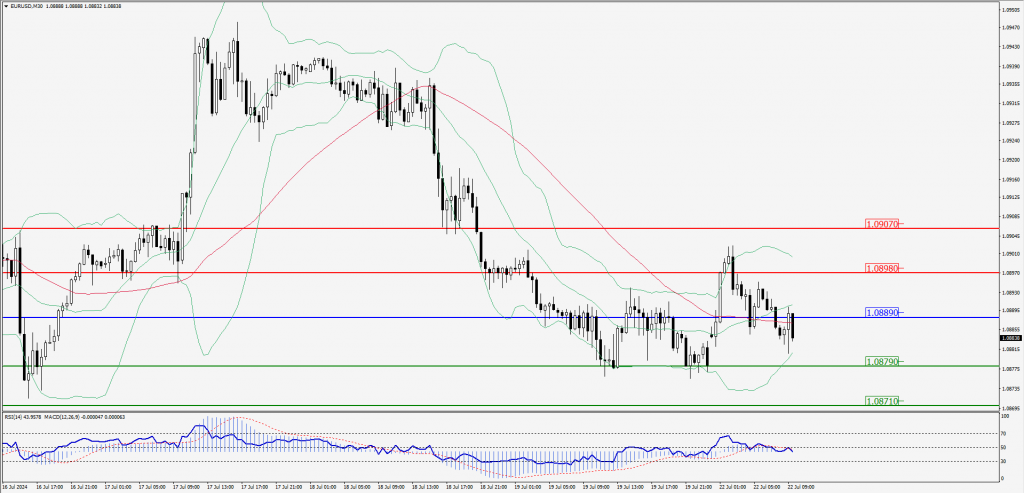
Green Lines Indicate Resistance Levels – Red Lines Indicate Support Levels
Light Blue is a Pivot Point – Black represents the price when the report was produced
GBP/USD Intraday: Trend on the downside
Our pivot point is at 1.29250
Preferable Price Action: Sell positions below pivot with targets at 1.29070 & 1.28930 in extension.
Alternative Price Action: The price above pivot would call for further upside to 1.29440 & 1.29600.
Comment: RSI is below 50 levels and Pairs below its 55MA & 20MA.
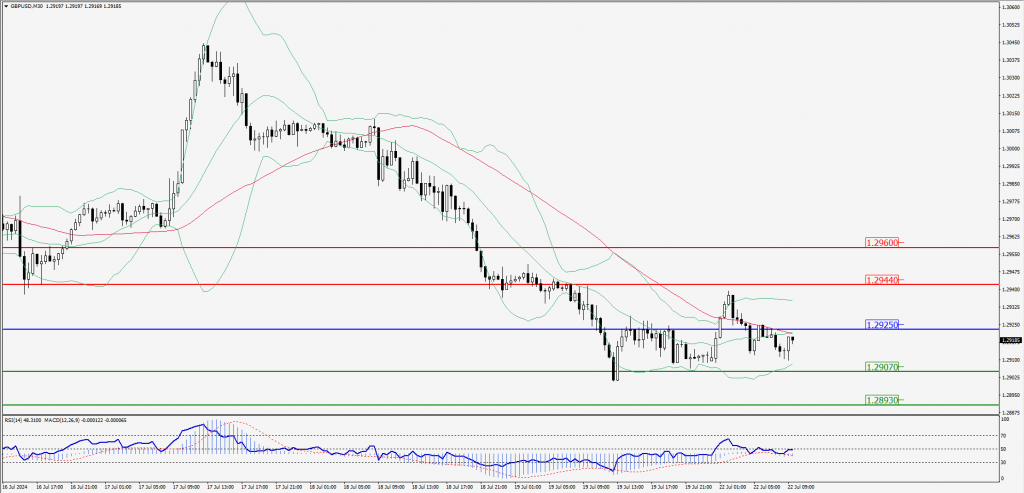
Green Lines Indicate Resistance Levels – Red Lines Indicate Support Levels
Light Blue is a Pivot Point – Black represents the price when the report was produced
USD/JPY Intraday: Major trend on the downside
Our pivot point is at 156.540
Preferable Price Action: Sell position below pivot with the target at 156.100 and 155.690 in extension.
Alternative Price Action: The upside breakout of the pivot would call for 157.010 and 157.420.
Comment: MACD is below 50 levels Pairs below its 55MA & 20MA.
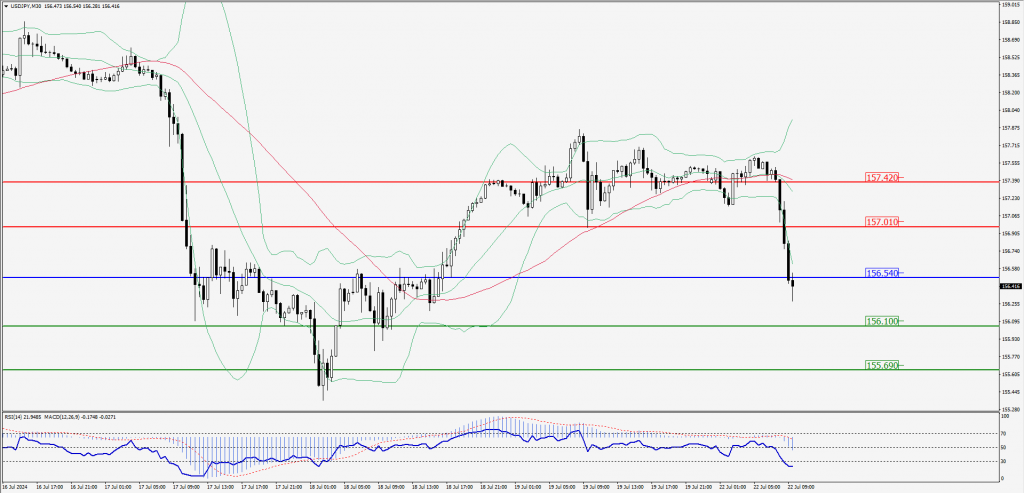
Green Lines Indicate Resistance Levels – Red Lines Indicate Support Levels
Light Blue is a Pivot Point – Black represents the price when the report was produced
AUD/USD Intraday: Trend on the downside
Our pivot point is at 0.66710
Preferable Price Action: Sell positions below pivot with targets at 0.66580 & 0.66490 in extension.
Alternative Price Action: Above pivot a further upside with 0.66840 & 0.66950 as targets.
Comment: RSI is below 50 levels and Pairs below its 55MA & 20MA.
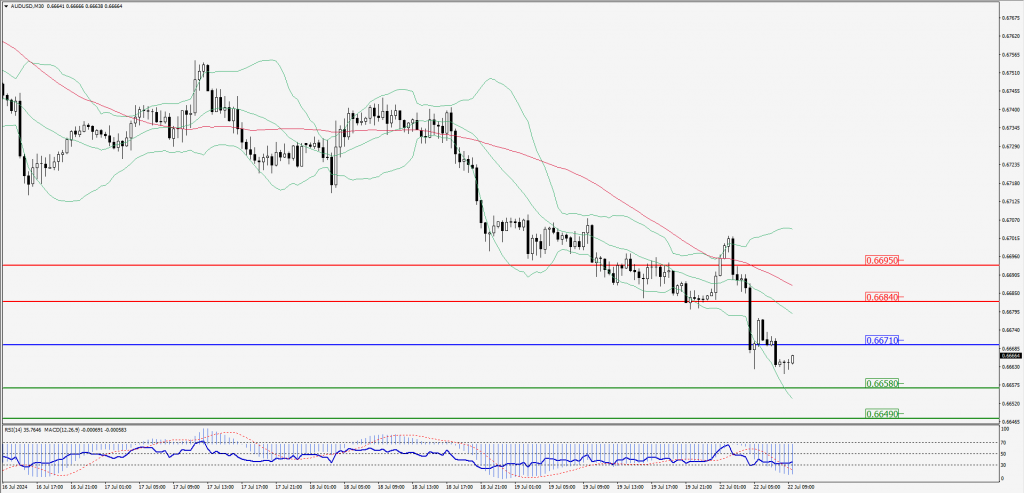
Green Lines Indicate Resistance Levels – Red Lines Indicate Support Levels
Light Blue is a Pivot Point – Black represents the price when the report was produced
CRUDEOIL Intraday: Trend on the downside
Our pivot point is at 78.89
Preferable Price Action: Below pivot sell oil with 78.33 & 77.89 as targets.
Alternative Price Action: Buy crude above pivot with targets at 79.42 and 79.86 in extension.
Comment: RSI is below 50 levels and pairs below its 55MA.
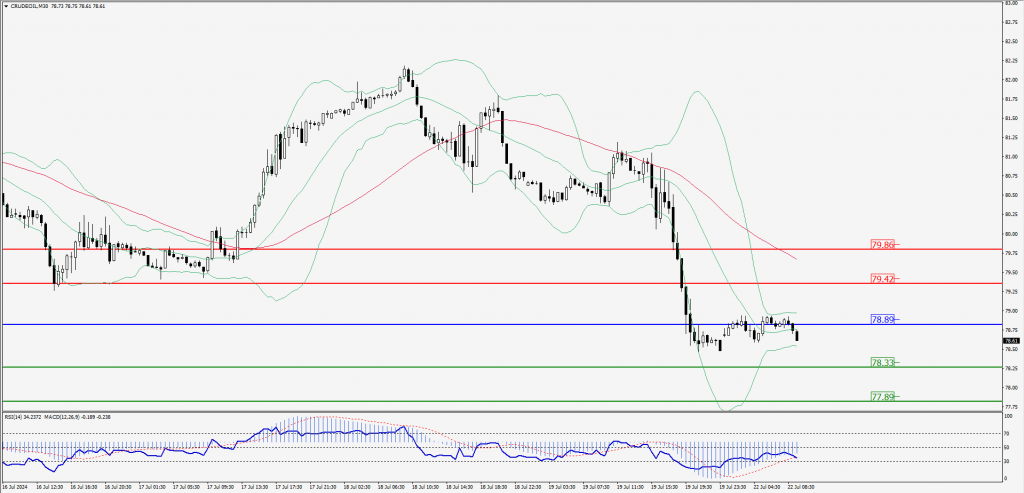
Green Lines Indicate Resistance Levels – Red Lines Indicate Support Levels
Light Blue is a Pivot Point – Black represents the price when the report was produced
XAU/USD Intraday: Trend on the downside
Our pivot point is at 2408.40
Preferable Price Action: Further downside to 2396.40 and 2387.50.
Alternative Price Action: If the price gives an upside breakout of a pivot, then the price extends to 2420.50 and 2429.90.
Comment: MACD is below 50 levels and Pairs below its 55MA & 20MA.
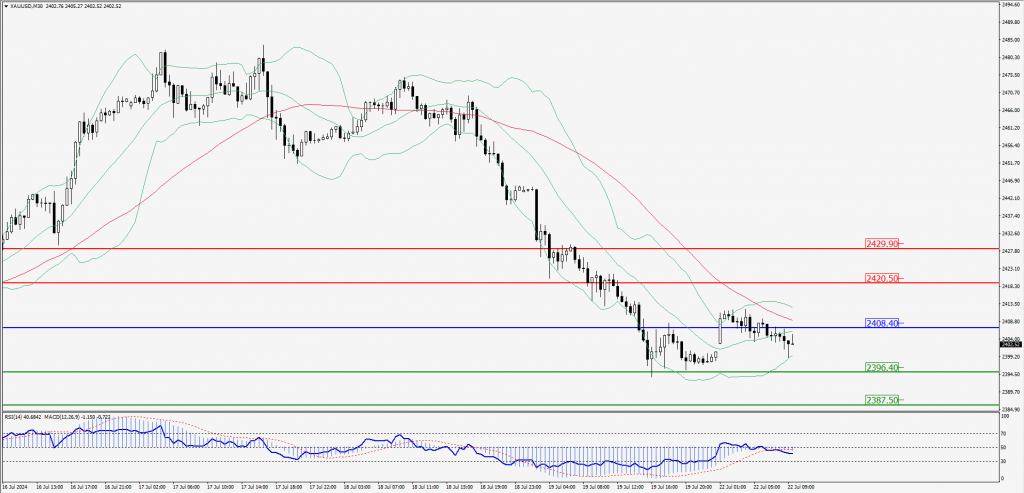
Green Lines Indicate Resistance Levels – Red Lines Indicate Support Levels
Light Blue is a Pivot Point – Black represents the price when the report was produced
Dow Jones Intraday: Trend on the downside
Our pivot point is 40,402.40
Preferable Price Action: Take sell positions below the pivot with targets at 40,257.30 & 40,161.70.
Alternative Price Action: Above 40,402.40 looks for further upside to 40,554.30 & 40,661.80.
Comment: RSI is below 50 levels and pairs below its 55MA.
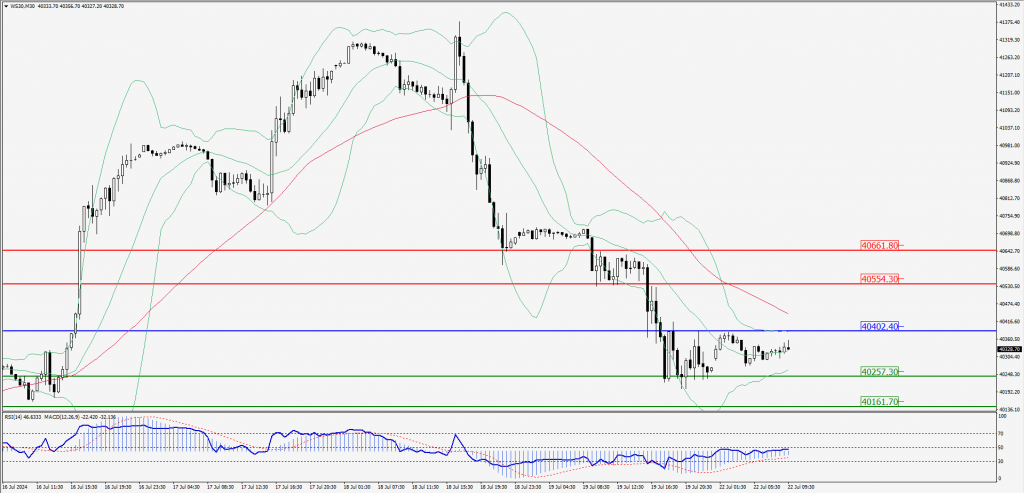
Green Lines Indicate Resistance Levels – Red Lines Indicate Support Levels
Light Blue is a Pivot Point – Black represents the price when the report was produced