Market Wrap: Stocks, Bonds, Commodities
The S&P 500 extended its losing streak to four sessions as Wall Street ended broadly lower on Wednesday, with investors cautious despite the latest guidance on rate policy from the US central bank showing few surprises.
The Dow Jones Industrial Average fell 84.50 points to 33,045.09, the S&P 500 lose 0.16% to 3,991.05 and the Nasdaq Composite add 14.77 points to 11,507.07
MSCI’s index of Asia-Pacific stocks outside Japan is advance 0.53% to 640.11 levels. The Australian index was lower by 0.40% to 7,285.40. Japanese Nikkei Index fell 1.34% today.
European stocks were mix on Thursday, with the Stoxx Europe 50 Index lose 0.18% to 4,242.88, Germany’s DAX rose 0.01% to 15,399.89, and France’s CAC decline 0.13% to 7,299.26, and U.K.’s FTSE 100 subtract 0.59% to 7,930.63.
Benchmark 10-year U.S. Treasury fell as demand for safe assets ascend again, today 10-year bond yields are positive 0.16% to 3.9290.
Oil prices fell by $2 per barrel to their lowest in two weeks on Wednesday, as investors became more concerned that recent data will prompt more aggressive interest rate increases by central banks, pressuring economic growth and fuel demand.
Spot Brent crude oil rose 0.22% to $80.78 per barrel. US West Texas Intermediate crude is down 0.22% to $74.11 a barrel.
The yellow metal gold is decline 0.23% to 1,837.25 dollars per ounce.
Market Wrap: Forex
European stock markets are expected to edge higher at the open Thursday, as investors digest the latest Federal Reserve minutes ahead of key Eurozone inflation data and more corporate earnings.
Today, the U.S. dollar index measures the Greenback against a trade-weighted basket of six major currencies, which slipped 0.14% to 104.380.
The Euro US Dollar (EUR/USD) is a widely traded pair that is up 0.12% today. This left the pair trading around $1.06140.
The Japanese yen was negative against the U.S. dollar on Thursday. Today USD/JPY is decline 0.04% to the 134.840 level.
Another commodity-related currency positive against the U.S dollar, AUD/USD gain 0.35% to 0.68270, and NZD/USD rose 0.38% to 0.62400 level.
EUR/USD Intraday: Trend on the upside
Our pivot point is at 1.06210
Preferable Price Action: Take long positions above pivot level with targets at 1.06510 & 1.06710 in extension.
Alternative Price Action: Below pivot looks for a further downside to 1.05940 & 1.05750.
Comment: RSI is above 50 levels and Pairs above 20MA.
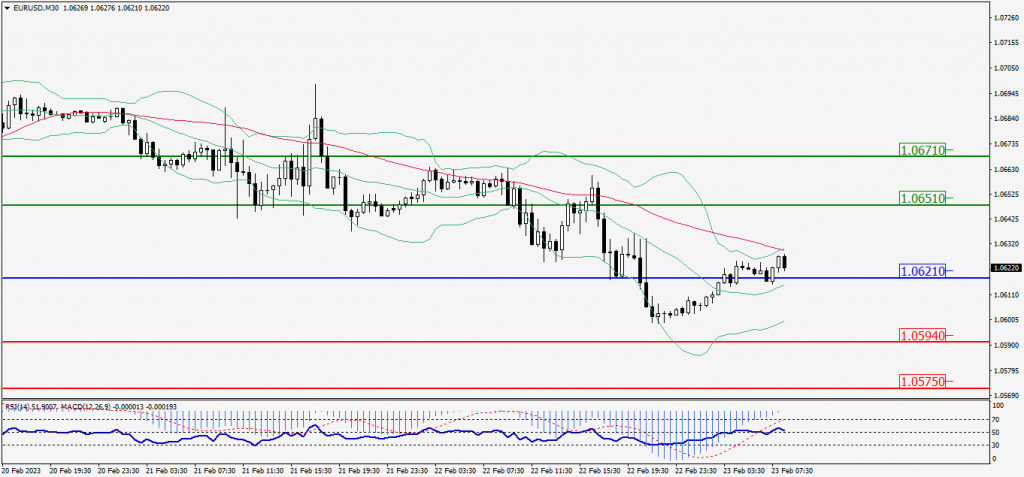
Green Lines Indicate Resistance Levels – Red Lines Indicate Support Levels
Light Blue is a Pivot Point – Black represents the price when the report was produced
GBP/USD Intraday: In a consolidation zone
Our pivot point is at 1.20590
Preferable Price Action: Buy positions above pivot with targets at 1.20910 & 1.21120 in extension.
Alternative Price Action: The price below pivot would call for further downside to 1.20290 & 1.20090.
Comment: RSI is at 50 levels and Pairs above 20MA.
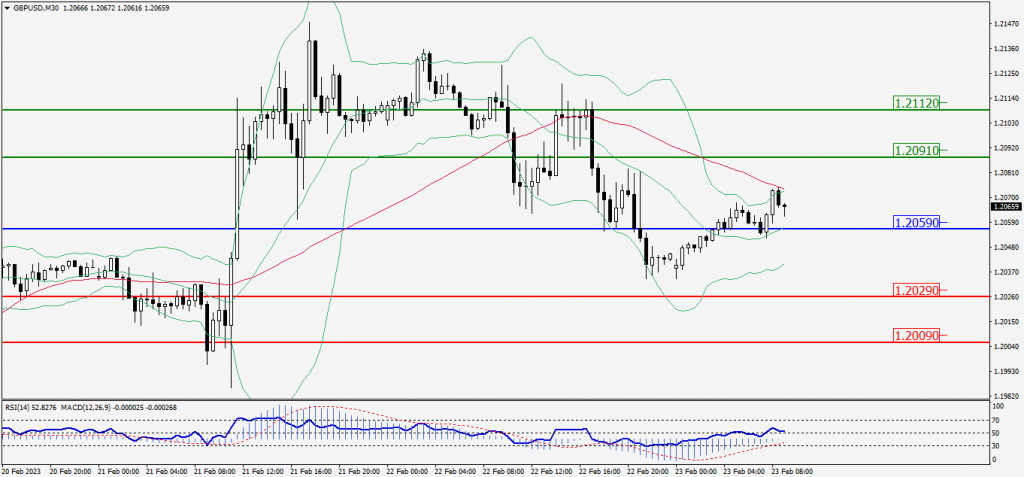
Green Lines Indicate Resistance Levels – Red Lines Indicate Support Levels
Light Blue is a Pivot Point – Black represents the price when the report was produced
USD/JPY Intraday: Resistance level at 134.930
Our pivot point is at 134.930
Preferable Price Action: Sell position below pivot with the target at 134.640 and 134.430 in extension.
Alternative Price Action: The upside breakout of the pivot would call for 135.220 and 135.430.
Comment: MACD is below 50 level and Pairs below 20MA.
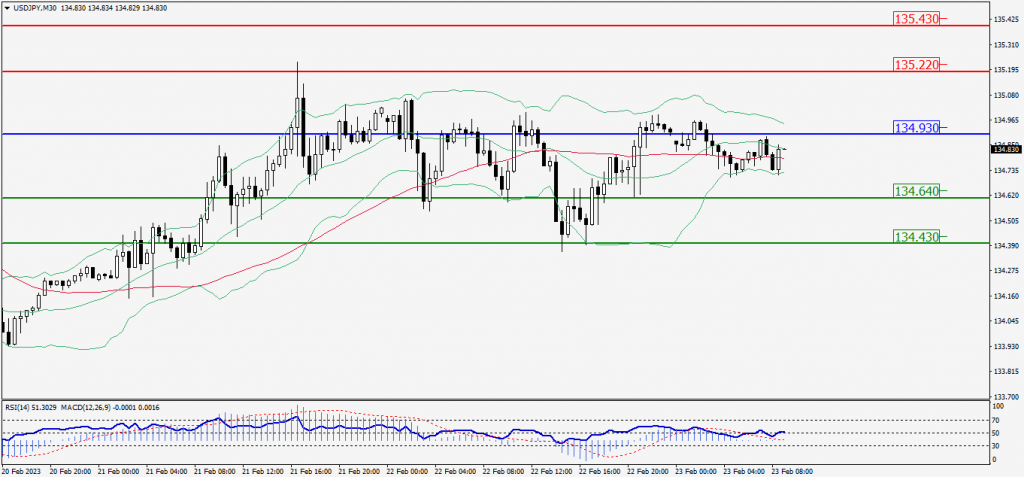
Green Lines Indicate Resistance Levels – Red Lines Indicate Support Levels
Light Blue is a Pivot Point – Black represents the price when the report was produced
AUD/USD Intraday: Support level at 0.68230
Our pivot point is at 0.68230
Preferable Price Action: Buy positions above pivot with targets at 0.68580 & 0.68820 in extension.
Alternative Price Action: Below pivot looks for a further downside with 0.67910 & 0.67680 as targets.
Comment: RSI is above 50 levels and pairs above its 20MA & 55MA.
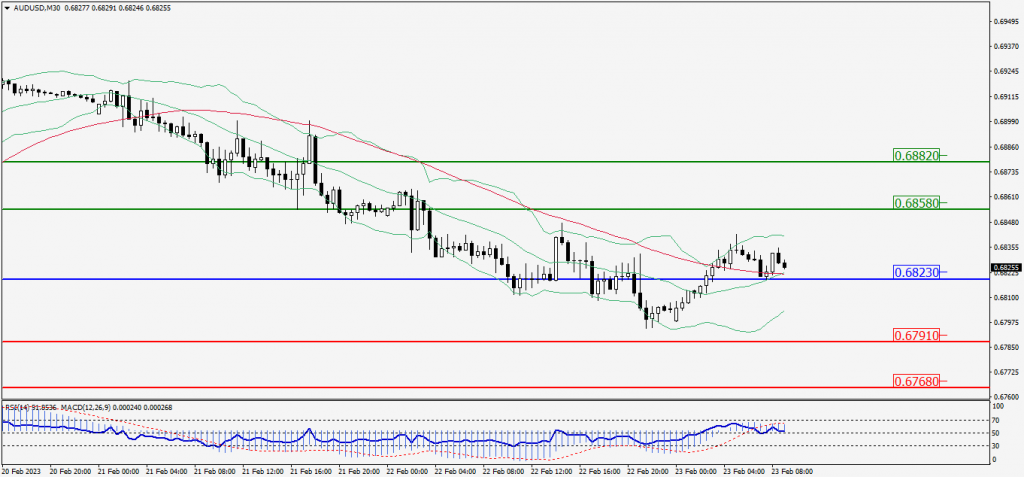
Green Lines Indicate Resistance Levels – Red Lines Indicate Support Levels
Light Blue is a Pivot Point – Black represents the price when the report was produced
CRUDEOIL Intraday: Trend on the downside
Our pivot point is at 74.57
Preferable Price Action: Below pivot sell oil with 73.39 & 72.69 as targets.
Alternative Price Action: Buy crude above pivot with targets at 75.79 and 76.52 in extension.
Comment: MACD is negative territory and Pairs below 55MA.
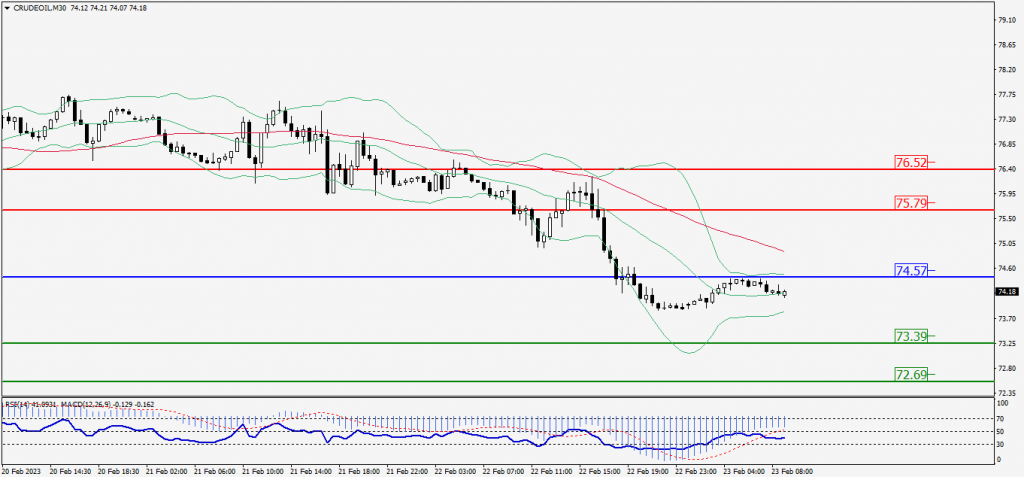
Green Lines Indicate Resistance Levels – Red Lines Indicate Support Levels
Light Blue is a Pivot Point – Black represents the price when the report was produced
XAU/USD Intraday: Trend on the upside
Our pivot point is 1830.90
Preferable Price Action: Further upside to 1835.10 and 1838.10
Alternative Price Action: If the price gives a downside breakout of a pivot, then the price extends to 1826.70 and 1823.90.
Comment: MACD is above 50 level and Pairs above 20MA .
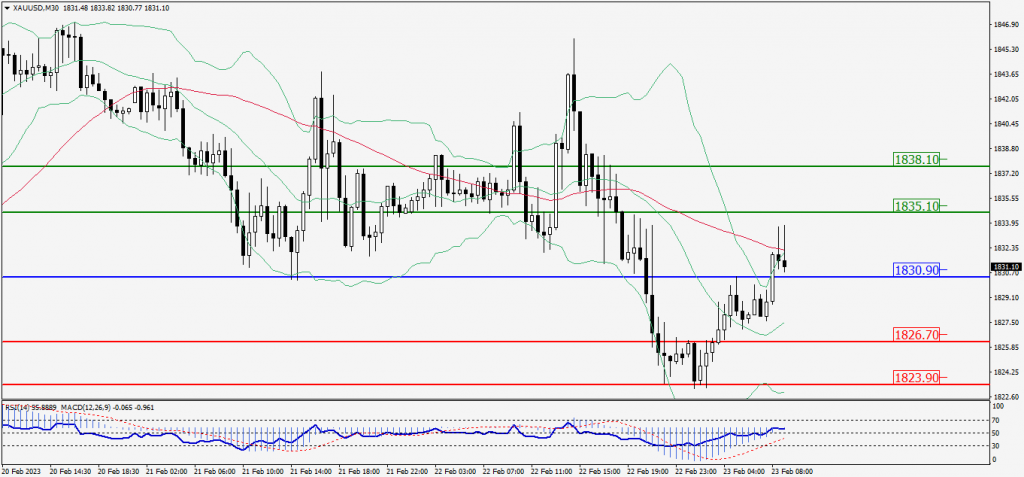
Green Lines Indicate Resistance Levels – Red Lines Indicate Support Levels
Light Blue is a Pivot Point – Black represents the price when the report was produced
Dow Jones Intraday: Resistance level at 33,206.00
Our pivot point is 33,206.00
Preferable Price Action: Take sell positions below the pivot with targets at 32,986.00 & 32,839.00.
Alternative Price Action: Above 33,206.00 looks for further upside to 33,414.00 & 33,566.00.
Comment: RSI is below 50 levels and Pairs below 55MA.
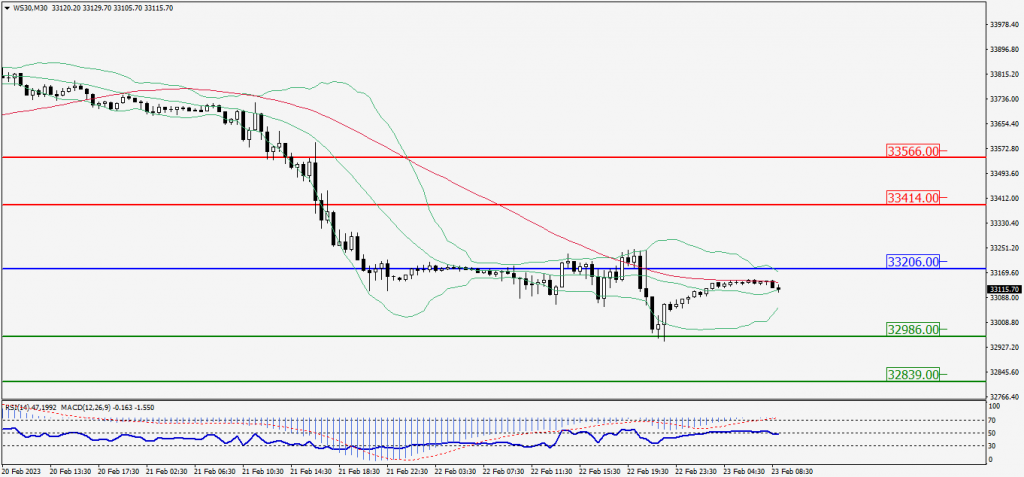
Green Lines Indicate Resistance Levels – Red Lines Indicate Support Levels
Light Blue is a Pivot Point – Black represents the price when the report was produced