Market Wrap: Stocks, Bonds, Commodities
Wall Street posted its worst performance of the year so far on Tuesday, with the main benchmarks ending down as investors interpreted a rebound in US business activity in February to indicate that interest rates need to stay higher for longer to control inflation.
The Dow Jones Industrial Average fell 697.10 points to 33,129.59, the S&P 500 lose 2.00% to 3,997.34 and the Nasdaq Composite subtract 294.97 points to 11,492.30
MSCI’s index of Asia-Pacific stocks outside Japan is decline 1.26% to 637.15 levels. The Australian index was lower by 0.30% to 7,314.50. Japanese Nikkei Index fell 1.34% today.
European stocks were negative on Wednesday, with the Stoxx Europe 50 Index lose 0.49% to 4,250.40, Germany’s DAX fell 0.52% to 15,397.62, and France’s CAC decline 0.37% to 7,308.65, and U.K.’s FTSE 100 subtract 0.46% to 7,977.75.
Benchmark 10-year U.S. Treasury fell as demand for safe assets ascend again, today 10-year bond yields are positive 0.70% to 3.9250.
Brent crude oil slipped more than 1 percent in a volatile session on Tuesday as persistent concerns about global economic growth outweighed supply curbs and prompted investors to take profits on the previous day’s gains.
Spot Brent crude oil fell 0.52% to $82.62 per barrel. US West Texas Intermediate crude is down 0.63% to $75.88 a barrel.
The yellow metal gold is advance 0.15% to 1,845.20 dollars per ounce.
Market Wrap: Forex
The U.S. dollar edged lower in early European trade Wednesday, handing back some of the previous session’s gains as traders cautiously await the release of the minutes of the Federal Reserve’s February meeting.
Today, the U.S. dollar index measures the Greenback against a trade-weighted basket of six major currencies, which slipped 0.08% to 104.025.
The Euro US Dollar (EUR/USD) is a widely traded pair that is up 0.10% today. This left the pair trading around $1.06570.
The Japanese yen was negative against the U.S. dollar on Wednesday. Today USD/JPY is decline 0.20% to the 134.720 level.
Another commodity-related currency mixed against the U.S dollar, AUD/USD lose 0.26% to 0.68340, and NZD/USD rose 0.39% to 0.62360 level.
EUR/USD Intraday: Support level at 1.06540
Our pivot point is at 1.06540
Preferable Price Action: Take long positions above pivot level with targets at 1.06710 & 1.06840 in extension.
Alternative Price Action: Below pivot looks for a further downside to 1.06370 & 1.06240.
Comment: RSI is above 50 levels and Pairs above 20MA.
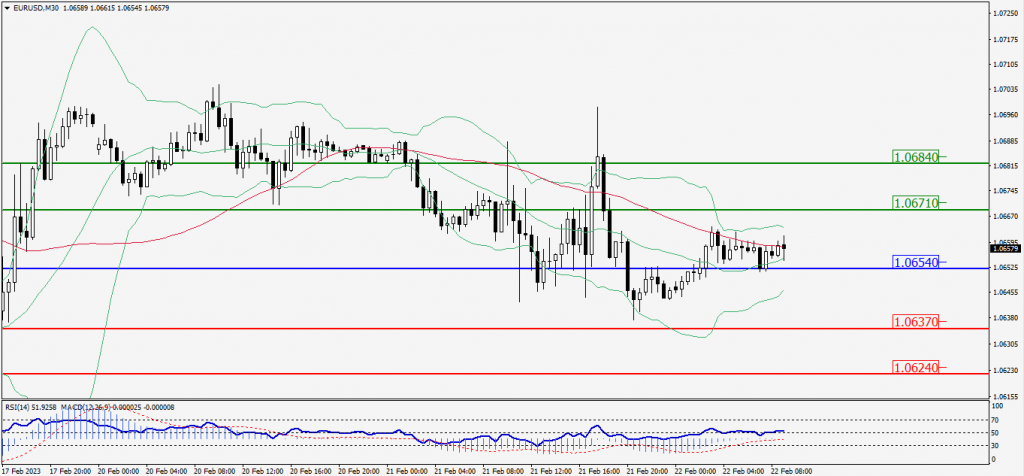
Green Lines Indicate Resistance Levels – Red Lines Indicate Support Levels
Light Blue is a Pivot Point – Black represents the price when the report was produced
GBP/USD Intraday: In a consolidation zone
Our pivot point is at 1.21020
Preferable Price Action: Buy positions above pivot with targets at 1.21670 & 1.21400 in extension.
Alternative Price Action: The price below pivot would call for further downside to 1.20640 & 1.20350.
Comment: RSI is at 50 levels and Pairs above 55MA.
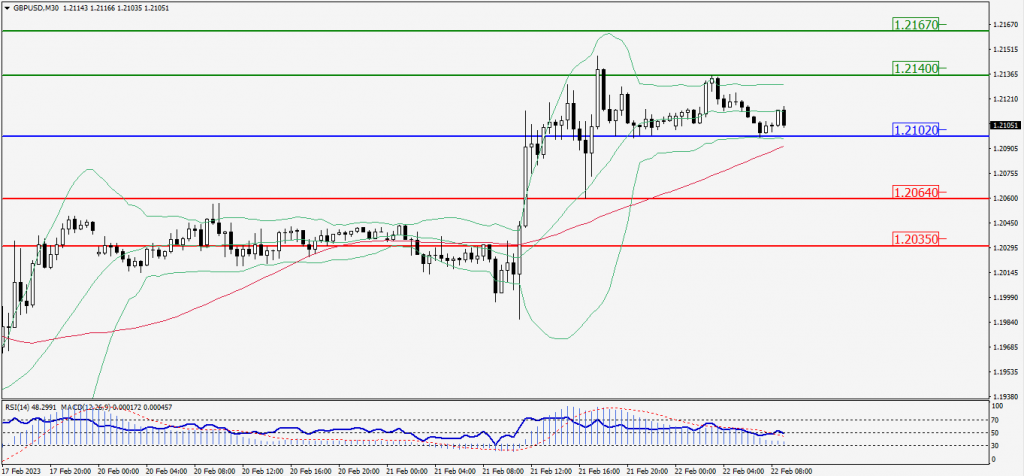
Green Lines Indicate Resistance Levels – Red Lines Indicate Support Levels
Light Blue is a Pivot Point – Black represents the price when the report was produced
USD/JPY Intraday: Resistance level at 134.870
Our pivot point is at 134.870
Preferable Price Action: Sell position below pivot with the target at 134.630 and 134.440 in extension.
Alternative Price Action: The upside breakout of the pivot would call for 135.130 and 135.330.
Comment: MACD is below 50 level and Pairs below 20MA.
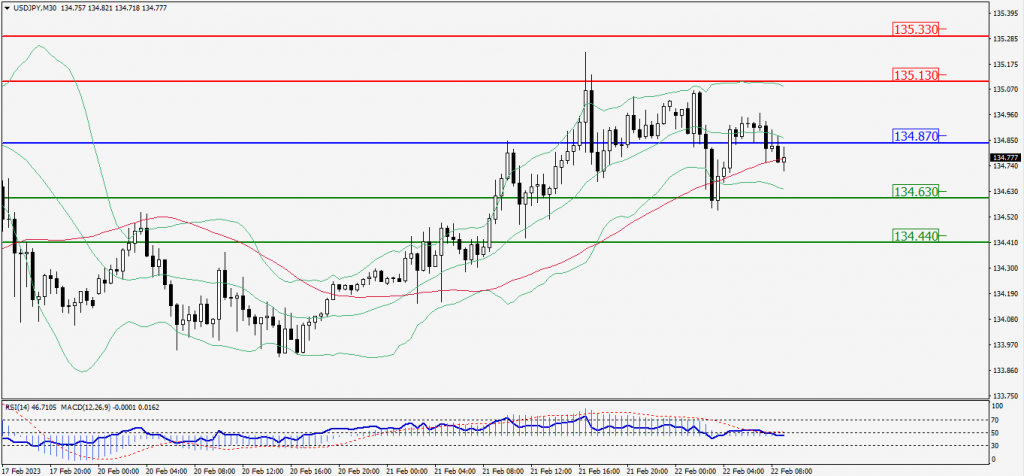
Green Lines Indicate Resistance Levels – Red Lines Indicate Support Levels
Light Blue is a Pivot Point – Black represents the price when the report was produced
AUD/USD Intraday: Trend on the downside
Our pivot point is at 0.68380
Preferable Price Action: Sell positions below pivot with targets at 0.68030 & 0.67740 in extension.
Alternative Price Action: Above pivot looks for a further upside with 0.68760 & 0.69020 as targets.
Comment: RSI is below 50 levels and pairs below its 20MA & 55MA.
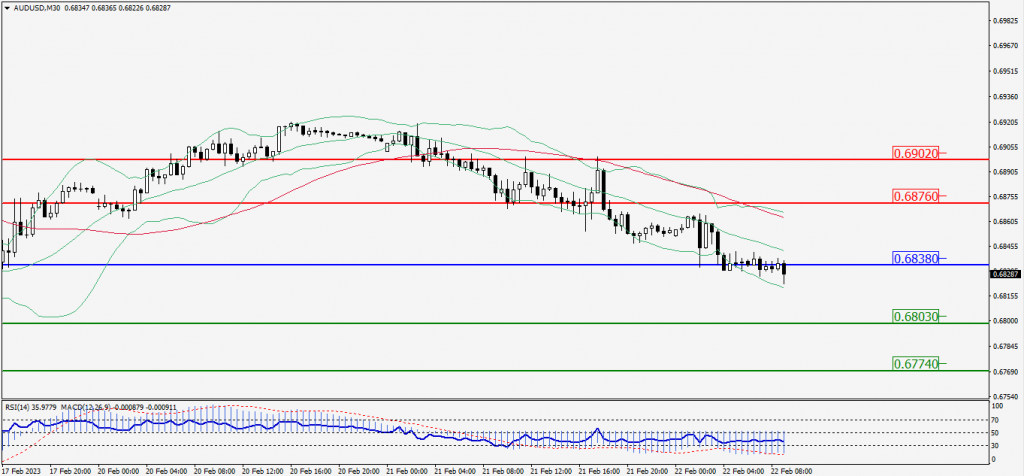
Green Lines Indicate Resistance Levels – Red Lines Indicate Support Levels
Light Blue is a Pivot Point – Black represents the price when the report was produced
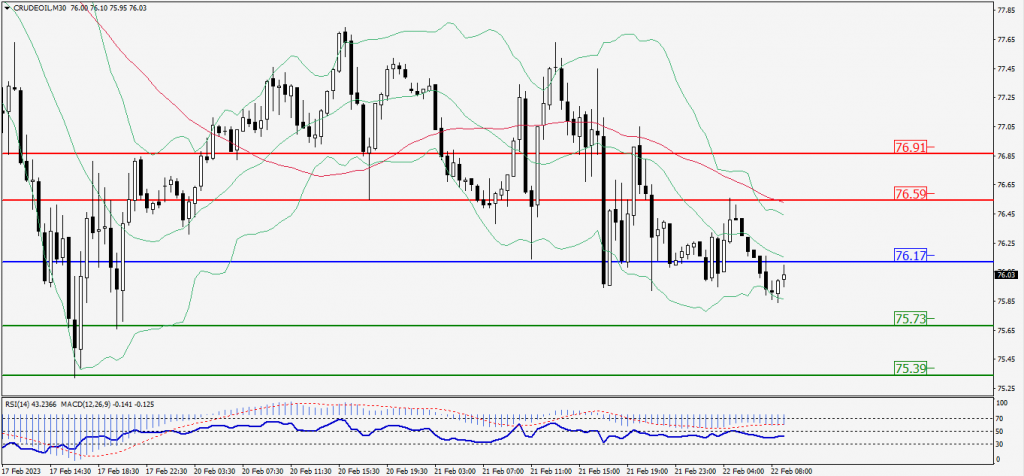
CRUDEOIL Intraday: Trend on the downside
Our pivot point is at 76.17
Preferable Price Action: Below pivot sell oil with 75.73 & 75.39 as targets.
Alternative Price Action: Buy crude above pivot with targets at 76.59 and 76.91 in extension.
Comment: MACD is negative territory and Pairs below its 20MA & 55MA.
Green Lines Indicate Resistance Levels – Red Lines Indicate Support Levels
Light Blue is a Pivot Point – Black represents the price when the report was produced
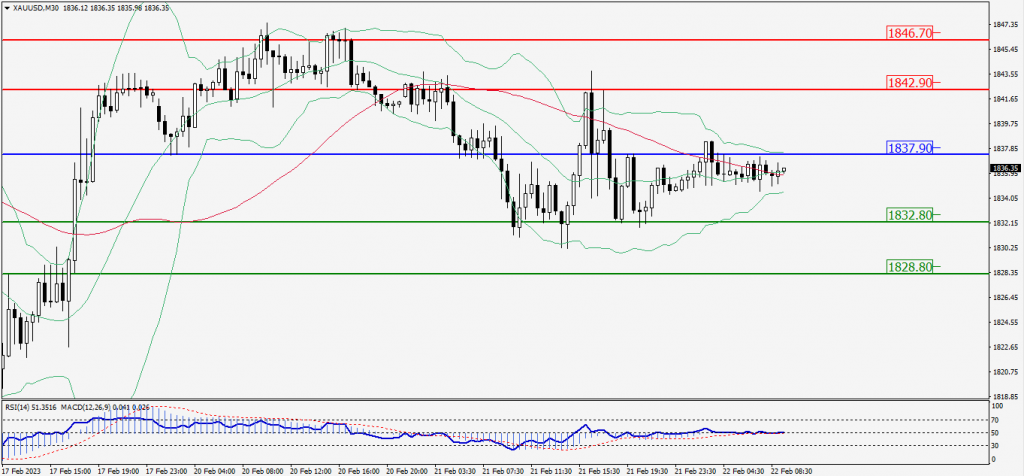
XAU/USD Intraday: In a consolidation zone
Our pivot point is 1837.90
Preferable Price Action: Further downside to 1832.80 and 1828.80
Alternative Price Action: If the price gives an upside breakout of a pivot, then the price extends to 1842.90 and 1846.70.
Comment: MACD is at 50 level.
Green Lines Indicate Resistance Levels – Red Lines Indicate Support Levels
Light Blue is a Pivot Point – Black represents the price when the report was produced
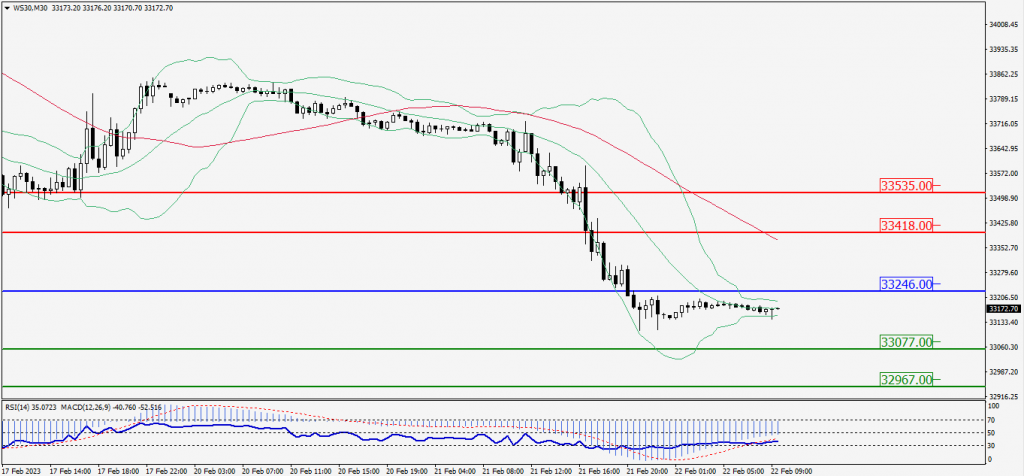
Dow Jones Intraday: Trend on the downside
Our pivot point is 33,246.00
Preferable Price Action: Take sell positions below the pivot with targets at 33,077.00 & 32,967.00.
Alternative Price Action: Above 33,246.00 looks for further upside to 33,418.00 & 33,535.00.
Comment: RSI is below 50 levels and Pairs below 55MA.
Green Lines Indicate Resistance Levels – Red Lines Indicate Support Levels
Light Blue is a Pivot Point – Black represents the price when the report was produced