Market Wrap: Stocks, Bonds, Commodities
Wall Street ended a topsy-turvy Thursday in positive territory, with the S&P 500 snapping a four-session losing streak, as investors grappled with how interest rate policy might affect the US economy.
The Dow Jones Industrial Average rose 108.82 points to 33,153.91, the S&P 500 gain 0.53% to 4,012.32 and the Nasdaq Composite add 83.33 points to 11,590.40
MSCI’s index of Asia-Pacific stocks outside Japan is decline 1.39% to 630.69 levels. The Australian index was lower by 0.30% to 7,307.00. Japanese Nikkei Index rose 1.29% today.
European stocks were mix on Friday, with the Stoxx Europe 50 Index gain 0.36% to 4,258.16, Germany’s DAX rose 0.49% to 15,475.69, and France’s CAC advance 0.25% to 7,317.43, and U.K.’s FTSE 100 subtract 0.29% to 7,907.72.
Benchmark 10-year U.S. Treasury fell as demand for safe assets ascend again, today 10-year bond yields are negative 0.65% to 3.8560.
Oil prices settled up 2% on Thursday on expectations of steep cuts to Russian production next month, but a stronger dollar and a sharper-than-expected jump in US inventories added to demand concerns.
Spot Brent crude oil rose 0.95% to $82.99 per barrel. US West Texas Intermediate crude is up 0.96% to $76.11 a barrel.
The yellow metal gold is advance 0.19% to 1,830.20 dollars per ounce.
Market Wrap: Forex
European stock markets are expected to open higher Friday on signs the region’s economy is slowly recovering, ahead of the release of the Federal Reserve’s preferred inflation measure.
Today, the U.S. dollar index measures the Greenback against a trade-weighted basket of six major currencies, which surge 0.04% to 104.582.
The Euro US Dollar (EUR/USD) is a widely traded pair that is down 0.04% today. This left the pair trading around $1.05910.
The Japanese yen was negative against the U.S. dollar on Friday. Today USD/JPY is decline 0.05% to the 134.630 level.
Another commodity-related currency negative against the U.S dollar, AUD/USD lose 0.10% to 0.68000, and NZD/USD fell 0.02% to 0.62260 level.
EUR/USD Intraday: Resistance level at 1.06090
Our pivot point is at 1.06090
Preferable Price Action: Take short positions below pivot level with targets at 1.05700 & 1.05440 in extension.
Alternative Price Action: Above pivot looks for a further upside to 1.06480 & 1.06750.
Comment: RSI is below 50 levels and Pairs below 55MA.
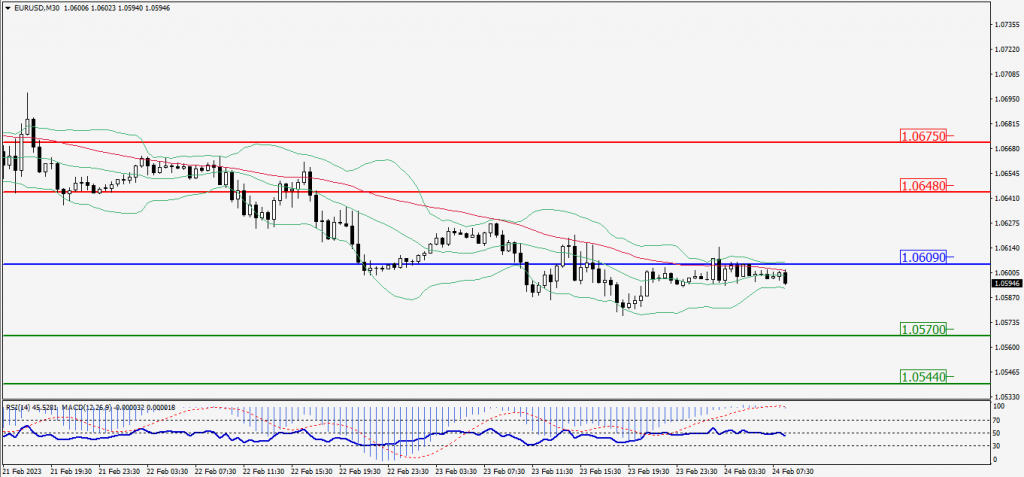
Green Lines Indicate Resistance Levels – Red Lines Indicate Support Levels
Light Blue is a Pivot Point – Black represents the price when the report was produced
GBP/USD Intraday: Trend on the downside
Our pivot point is at 1.20290
Preferable Price Action: Sell positions below pivot with targets at 1.19790 & 1.19470 in extension.
Alternative Price Action: The price above pivot would call for further upside to 1.20770 & 1.21110.
Comment: RSI is below 50 levels and Pairs below its 20MA & 55MA.
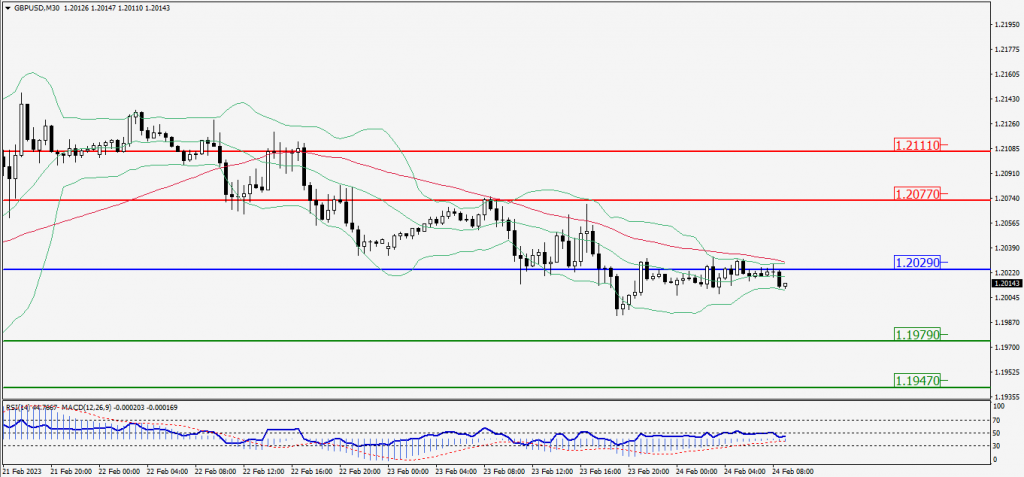
Green Lines Indicate Resistance Levels – Red Lines Indicate Support Levels
Light Blue is a Pivot Point – Black represents the price when the report was produced
USD/JPY Intraday: In a consolidation zone
Our pivot point is at 134.770
Preferable Price Action: Sell position below pivot with the target at 134.520 and 134.340 in extension.
Alternative Price Action: The upside breakout of the pivot would call for 135.010 and 135.190.
Comment: MACD is at 50 level and Pairs below 55MA.
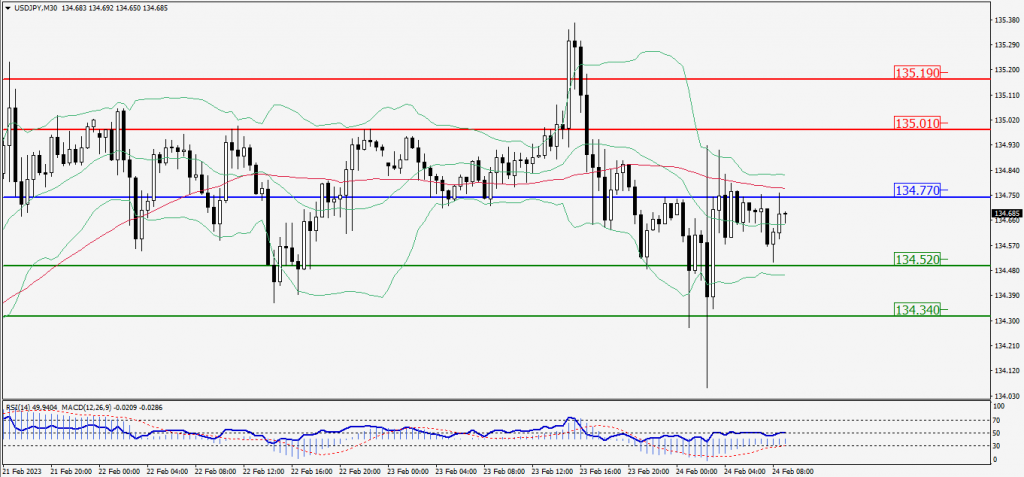
Green Lines Indicate Resistance Levels – Red Lines Indicate Support Levels
Light Blue is a Pivot Point – Black represents the price when the report was produced
AUD/USD Intraday: Trend on the downside
Our pivot point is at 0.68140
Preferable Price Action: Sell positions below pivot with targets at 0.67760 & 0.67520 in extension.
Alternative Price Action: Above pivot looks for a further upside with 0.68520 & 0.68760 as targets.
Comment: RSI is below 50 levels and pairs below its 20MA & 55MA.
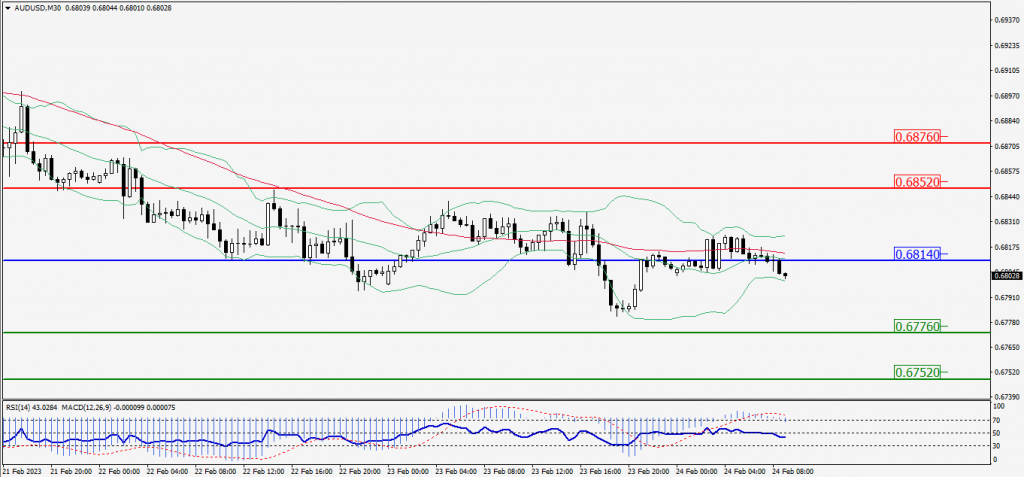
Green Lines Indicate Resistance Levels – Red Lines Indicate Support Levels
Light Blue is a Pivot Point – Black represents the price when the report was produced
CRUDEOIL Intraday: Major trend on the upside
Our pivot point is at 75.95
Preferable Price Action: Above pivot buy oil with 76.63 & 77.17 as targets.
Alternative Price Action: Sell crude below pivot with targets at 75.22 and 74.67 in extension.
Comment: MACD is positive territory and Pairs above its 20MA & 55MA.
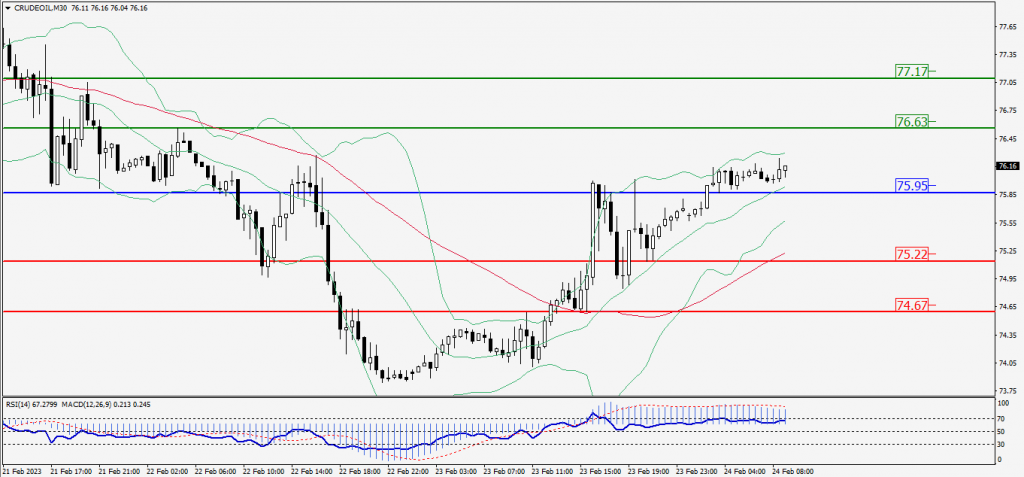
Green Lines Indicate Resistance Levels – Red Lines Indicate Support Levels
Light Blue is a Pivot Point – Black represents the price when the report was produced
XAU/USD Intraday: Resistance level at 1827.20
Our pivot point is 1827.20
Preferable Price Action: Further downside to 1820.70 and 1816.30
Alternative Price Action: If the price gives a upside breakout of a pivot, then the price extends to 1833.50 and 1838.10.
Comment: MACD is below 50 level and Pairs below 55MA .
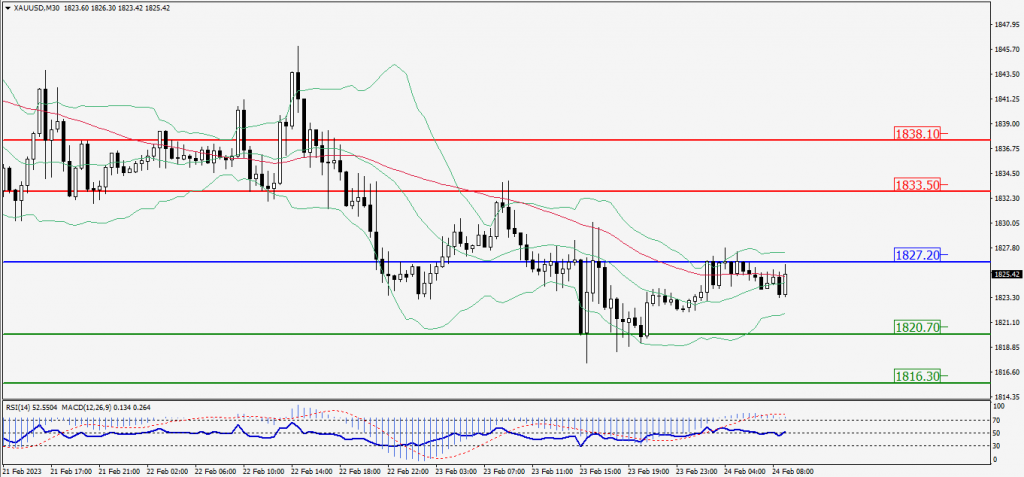
Green Lines Indicate Resistance Levels – Red Lines Indicate Support Levels
Light Blue is a Pivot Point – Black represents the price when the report was produced
Dow Jones Intraday: Support level at 33,076.00
Our pivot point is 33,076.00
Preferable Price Action: Take buy positions above the pivot with targets at 33,235.00 & 33,347.00.
Alternative Price Action: Below 33,076.00 looks for further downside to 32,926.00 & 32,820.00.
Comment: RSI is above 50 levels and Pairs above 55MA.
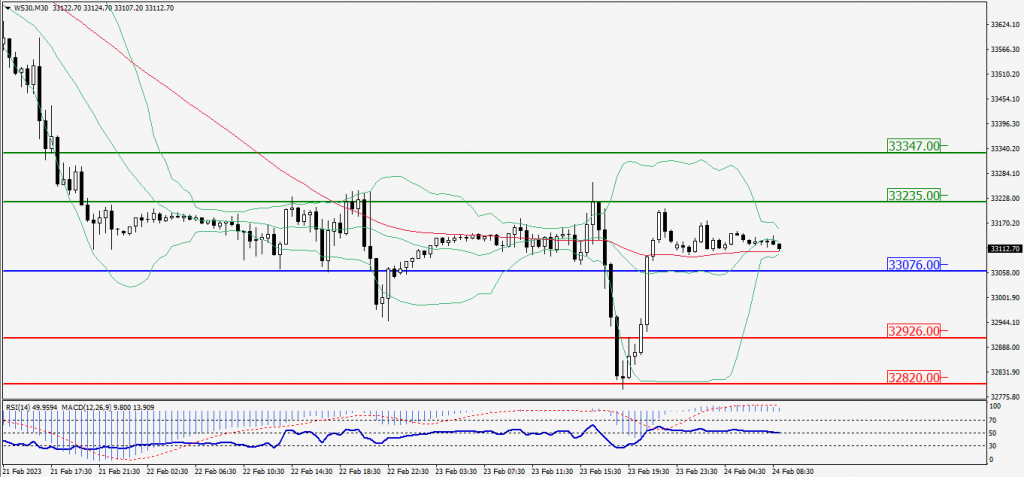
Green Lines Indicate Resistance Levels – Red Lines Indicate Support Levels
Light Blue is a Pivot Point – Black represents the price when the report was produced