Market Wrap: Stocks, Bonds, Commodities
Wall Street’s main indices fell on Tuesday, with the S&P 500 confirming a correction, as the Ukraine-Russia crisis kept investors on the edge after Russian President Vladimir Putin recognised two breakaway regions in the country and ordered troops to the area.
The S&P 500 Lost (1.01%) ended at 4,304.74 points, while the Nasdaq Composite fell 1.23% to 13,381.52. The Dow Jones Industrial was down 1.42% to 33,596.61.
MSCI’s index of Asia-Pacific stocks outside Japan is rose 0.38%, to 766.63 levels. Australian index up 0.62% to 7,205.70. Japanese Nikkei Index fell 1.71% to 26,449.61.
European stocks were Positive on Wednesday, with the Stoxx Europe 50 Index rose 1.05% to 4.027.45 Germany’s DAX gain 0.95% to 14,832.18, and France’s CAC pulled climb 0.85% to 6,845.28, and U.K.’s FTSE 100 collected 0.51% to 7,532.07.
Benchmark 10-year U.S. Treasury rose as demand for safe assets gain again, today 10-year bond yields a positive 1.969.
Oil prices took a breather on Wednesday after surging to seven-year highs in the previous session as it became clear the first wave of US and European sanctions on Russia for sending troops into eastern Ukraine would not disrupt the oil supply.
Spot Brent crude oil rose 0.16% to $94.00 per barrel. US West Texas Intermediate crude up 0.18% to $92.08 a barrel.
The yellow metal gold is down 0.52% to 1,897.55 dollars per ounce.
Market Wrap: Forex
The Canadian dollar was little changed against its U.S. counterpart on Tuesday as investors weighed the economic impact of Russia-Ukraine tensions, and the price of oil, one of Canada’s major exports, gave back some of its earlier gains.
Today, the U.S. dollar index measures the Greenback against a trade-weighted basket of six major currencies, which is rose 0.06% today 96.073.
The Euro US Dollar (EUR/USD) is a widely traded pair that is positive today. This left the pair trading around $1.13370.
The Japanese yen was neutral against the U.S. dollar on Wednesday as the stock constant. Today USD/JPY is flat at 115.080 level.
Another commodity-related currency positive against the U.S dollar, AUD/USD rose 0.28% to 0.72390, and NZD/USD Gained 0.53% to 0.67670 level.
EUR/USD Intraday: In a Consolidation Zone
Our pivot point is at 1.13460
Preferable Price Action: Take Short positions Below pivot level with targets at 1.13120 & 1.12830 in extension.
Alternative Price Action: Above pivot looks for a further Upside to 1.13790 & 1.14070.
Comment: RSI at 50 levels.
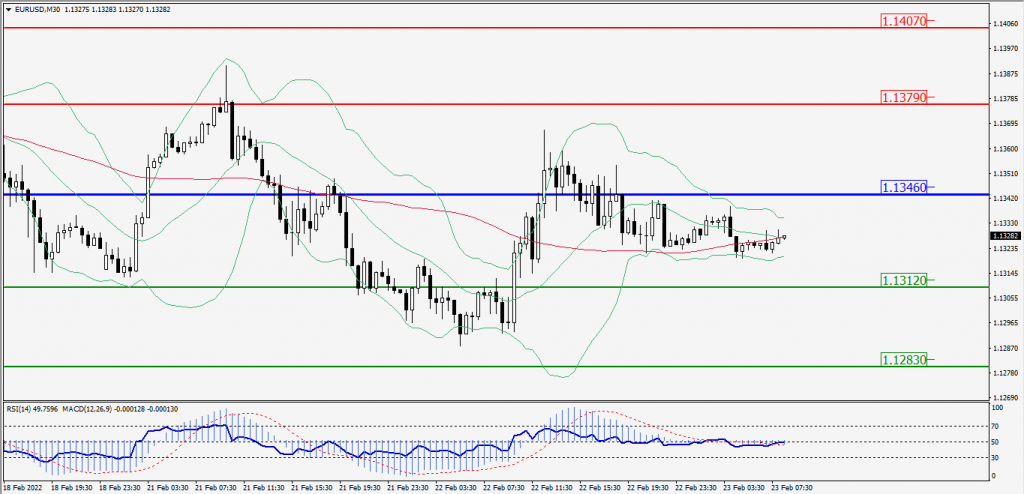
Green Lines Indicate Resistance Levels – Red Lines Indicates Support Levels
Light Blue is a Pivot Point – Black represents the price when the report was produced
GBP/USD Intraday: Support Level at 1.35790
Our pivot point is at 1.35790
Preferable Price Action: Buy positions Above pivot with targets at 1.36180 & 1.36510 in extension.
Alternative Price Action: The price Below pivot would call for further Downside to 1.35390 & 1.35070.
Comment: RSI Above 50 levels and Pair Above its 55MA & 20MA.
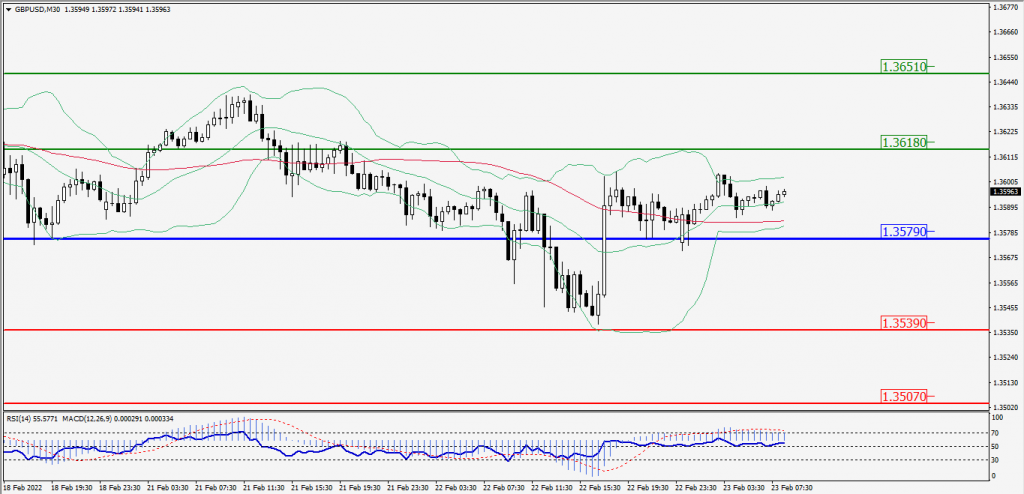
Green Lines Indicate Resistance Levels – Red Lines Indicates Support Levels
Light Blue is a Pivot Point – Black represents the price when the report was produced
USD/JPY Intraday: Trend on the Upside
Our pivot point is at 114.930
Preferable Price Action: Buy position Above pivot with the target at 115.240 and 115.490 in extension.
Alternative Price Action: The Downside breakout of the pivot would call for 114.620 and 114.360.
Comment: MACD in Positive territory and Pair Above 55MA.
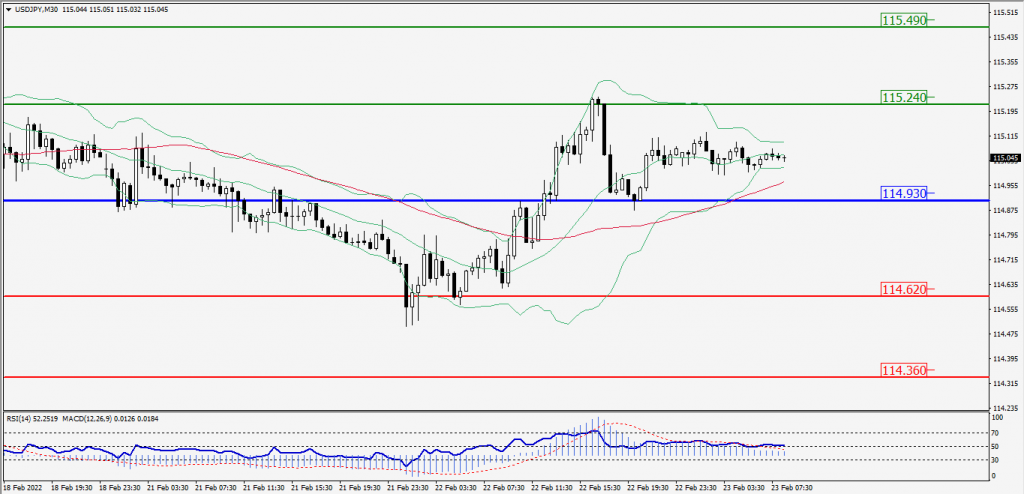
Green Lines Indicate Resistance Levels – Red Lines Indicates Support Levels
Light Blue is a Pivot Point – Black represents the price when the report was produced
AUD/USD Intraday: Trend on the Upside
Our pivot point is at 0.72190
Preferable Price Action: Buy Positions Above pivot with targets at 0.72630 & 0.72970 in extension.
Alternative Price Action: Below pivot looks for a further Downside with 0.71770 & 0.71430 as targets.
Comment: Pair above its 20MA & 55MA and RSI above 50 levels.
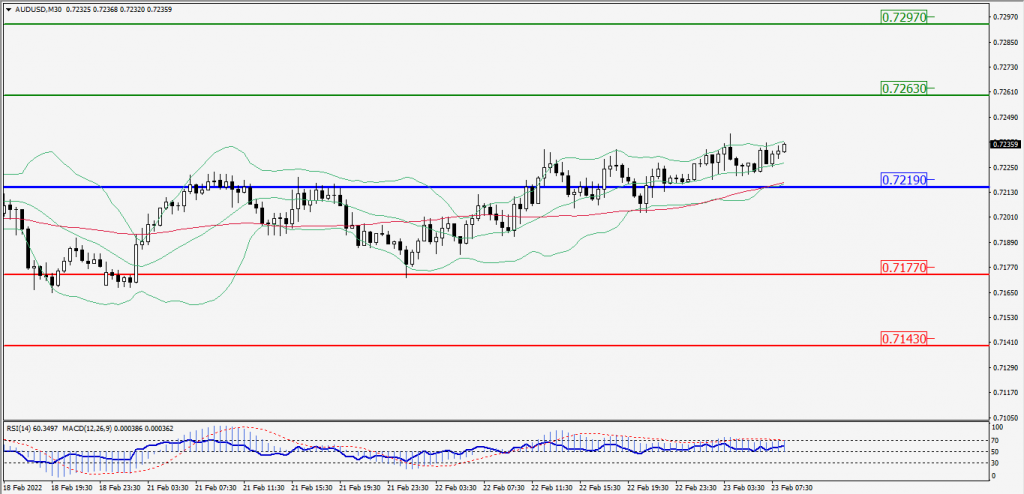
Green Lines Indicate Resistance Levels – Red Lines Indicates Support Levels
Light Blue is a Pivot Point – Black represents the price when the report was produced
CRUDEOIL Intraday: Trend On the Downside
Our pivot point is at 92.40
Preferable Price Action: Below pivots Sell Oil with 90.80 & 89.50 as targets.
Alternative Price Action: Buy crude Above pivot with targets at 93.90 and 95.10 in extension.
Comment: MACD is in the Negative territory and Pair Below 55MA.
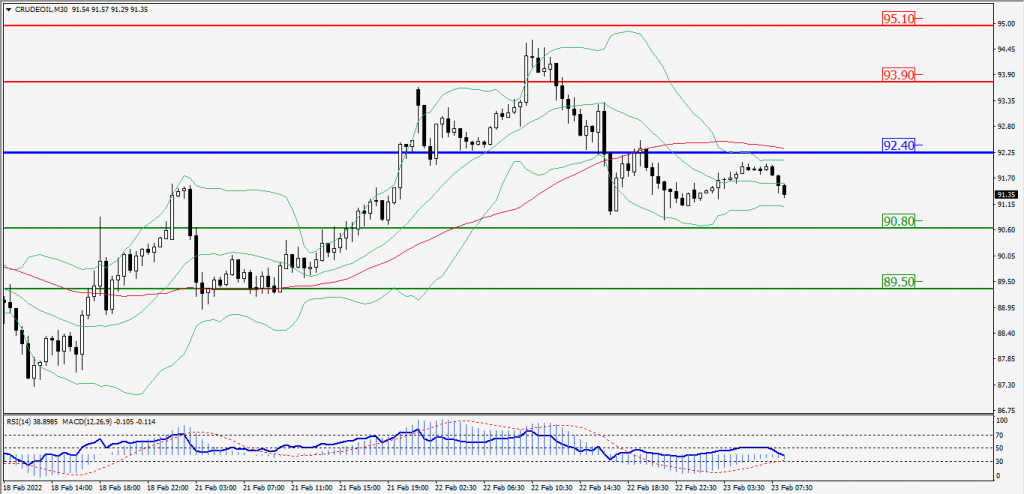
Green Lines Indicate Resistance Levels – Red Lines Indicates Support Levels
Light Blue is a Pivot Point – Black represents the price when the report was produced
XAU/USD Intraday: In a Consolidation Zone
Our pivot point is 1903.50
Preferable Price Action: Further Downside to 1890.60 and 1880.50.
Alternative Price Action: If the price gives an Upside breakout of a pivot, then the price extends to 1915.90 and 1926.20.
Comment: MACD is a Negative territory And Price Below its 20MA & 55MA.
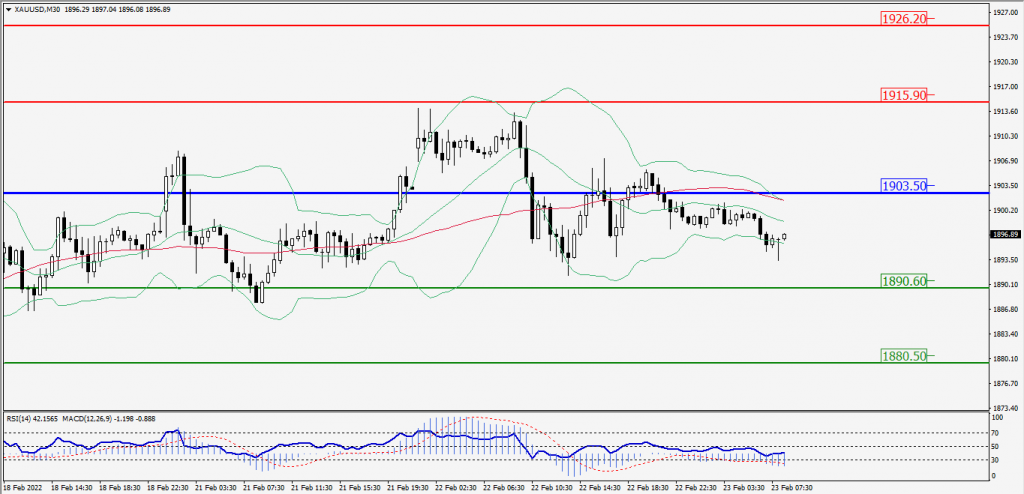
Green Lines Indicate Resistance Levels – Red Lines Indicates Support Levels
Light Blue is a Pivot Point – Black represents the price when the report was produced
Dow Jones Intraday: Major Trend on the Downside
Our pivot point is 33,920.00
Preferable Price Action: Take Short positions Below pivot with targets at 33,544.00 & 33,245.00.
Alternative Price Action: Above 33,920.00 looks for further Upside to 34,270.00 & 34,576.00.
Comment: RSI at 50 levels.
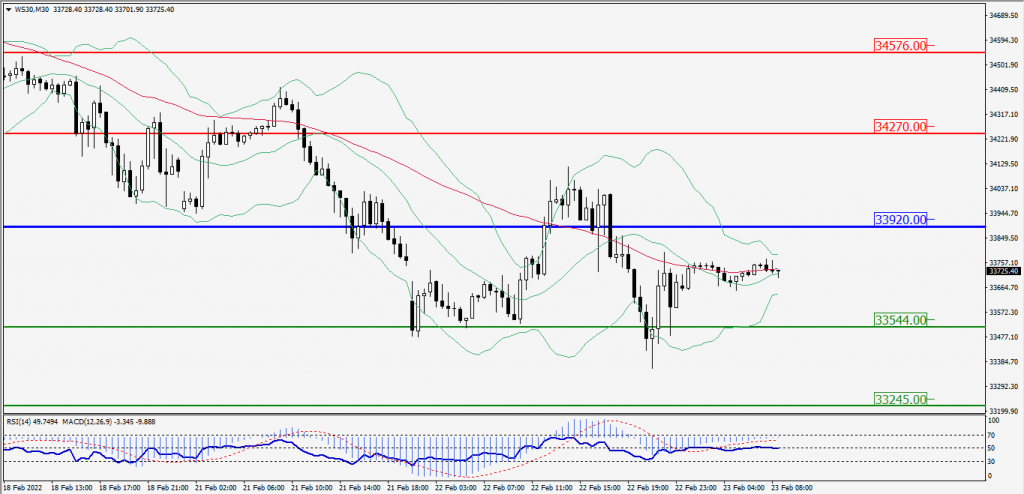
Green Lines Indicate Resistance Levels – Red Lines Indicates Support Levels
Light Blue is a Pivot Point – Black represents the price when the report was produced