Market Wrap: Stocks, Bonds, Commodities
Russian President Vladimir Putin ordered the deployment of troops to two breakaway regions in eastern Ukraine after recognizing them as independent on Monday, accelerating a crisis the West fears could unleash a major war.
The S&P 500 Lost (0.72%) ended at 4,348.87 points, while the Nasdaq Composite fell 1.23% to 13,548.07. The Dow Jones Industrial was down 0.68% to 34,079.18.
MSCI’s index of Asia-Pacific stocks outside Japan is down 1.54%, to 764.18 levels. Australian index down 1.00% to 7,161.30. Japanese Nikkei Index fell 1.71% to 26,449.61.
European stocks were Negative on Tuesday, with the Stoxx Europe 50 Index fell 0.82% to 3,953.15 Germany’s DAX fell 0.93% to 14,594.56, and France’s CAC pulled down 0.79% to 6,734.84, and U.K.’s FTSE 100 lost 0.35% to 7,457.90.
Benchmark 10-year U.S. Treasury fell as demand for safe assets down again, today 10-year bond yields negative 1.890.
Oil jumped to a seven-year high, safe-havens rallied and US stock futures dived on Tuesday as Europe’s eastern flank stood on the brink of war after Russian President Vladimir Putin ordered troops into breakaway regions of eastern Ukraine. Brent crude futures rose 4 percent to $97.35, their highest since September 2014.
Spot Brent crude oil rose 3.37% to $96.12 per barrel. US West Texas Intermediate crude up 4.83% to $94.57 a barrel.
The yellow metal gold collected 0.08% to 1,901.30 dollars per ounce.
Market Wrap: Forex
The dollar was up on Tuesday morning in Asia as Russia recognized two breakaway parts of eastern Ukraine, increasing concerns of a major war.
Today, the U.S. dollar index measures the Greenback against a trade-weighted basket of six major currencies, which is rose 0.04% today 96.060.
The Euro US Dollar (EUR/USD) is a widely traded pair that is positive today. This left the pair trading around $1.13220.
The Japanese yen was strong against the U.S. dollar on Tuesday as the stock up. Today USD/JPY is collected 0.11% at the 114.860 level.
Another commodity-related currency positive against the U.S dollar, AUD/USD rose 0.19% to 0.72040, and NZD/USD Gained 0.27% to 0.67160 level.
EUR/USD Intraday: Trend on the Downside
Our pivot point is at 1.13190
Preferable Price Action: Take Short positions Below pivot level with targets at 1.12810 & 1.12470 in extension.
Alternative Price Action: Above pivot looks for a further Upside to 1.13590 & 1.13910.
Comment: RSI Below 50 levels and Pair Below its 20MA & 55MA.
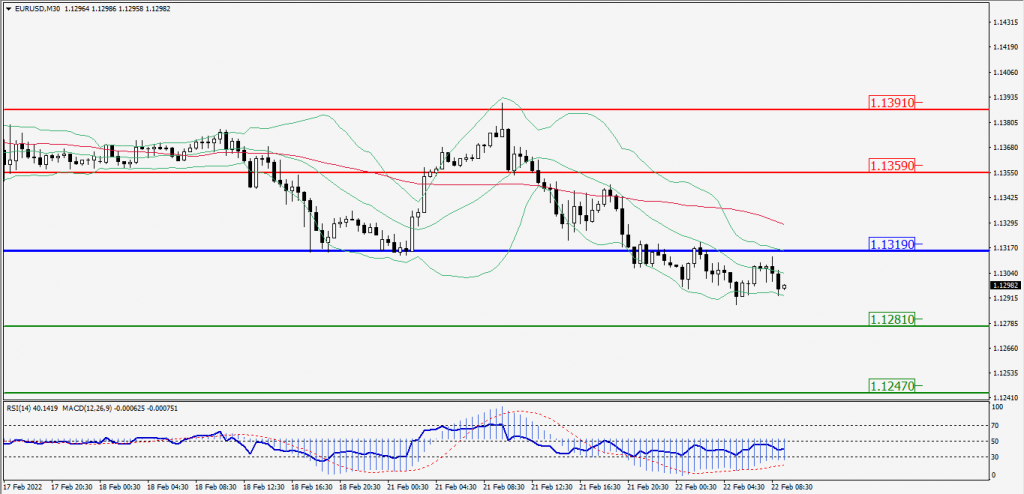
Green Lines Indicate Resistance Levels – Red Lines Indicates Support Levels
Light Blue is a Pivot Point – Black represents the price when the report was produced
GBP/USD Intraday: Trend On the Downside
Our pivot point is at 1.35920
Preferable Price Action: Sell positions Below pivot with targets at 1.35610 & 1.35360 in extension.
Alternative Price Action: The price Above pivot would call for further Upside to 1.36210 & 1.36470.
Comment: RSI below 50 levels and Pair Below its 55MA & 20MA.
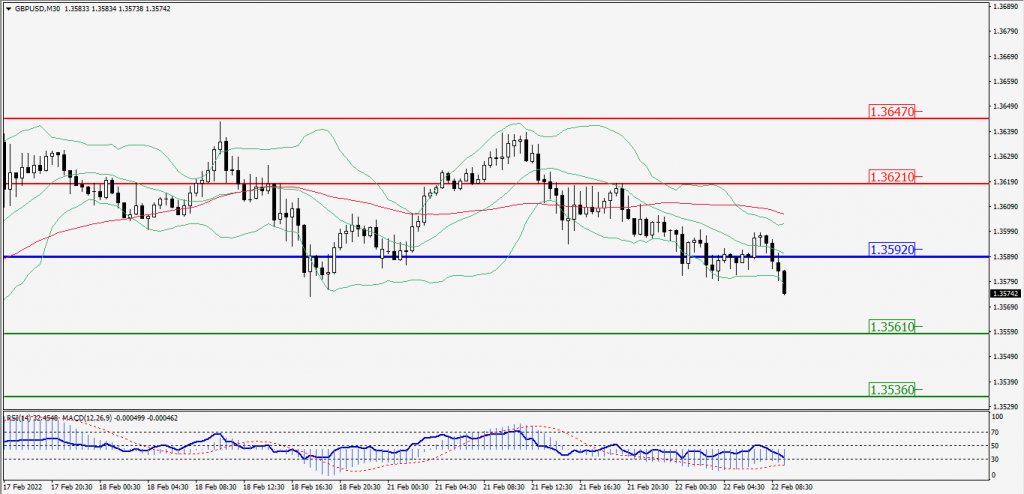
Green Lines Indicate Resistance Levels – Red Lines Indicates Support Levels
Light Blue is a Pivot Point – Black represents the price when the report was produced
USD/JPY Intraday: Trend on the Downside
Our pivot point is at 114.810
Preferable Price Action: Sell position Below pivot with the target at 114.530 and 114.310 in extension.
Alternative Price Action: The Upside breakout of the pivot would call for 115.080 and 115.310.
Comment: MACD in Negative territory and Pair Below its 55MA.
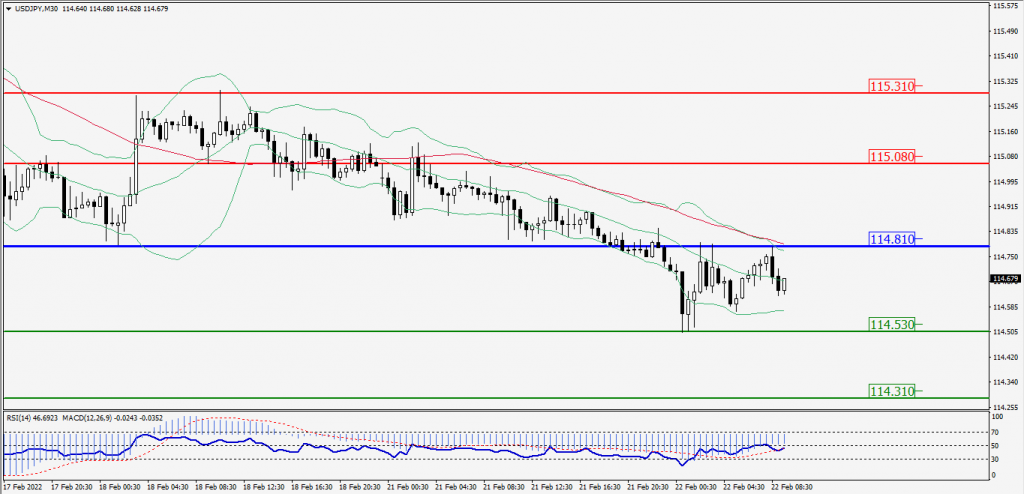
Green Lines Indicate Resistance Levels – Red Lines Indicates Support Levels
Light Blue is a Pivot Point – Black represents the price when the report was produced
AUD/USD Intraday: Resistance level at 0.72270
Our pivot point is at 0.72270
Preferable Price Action: Sell Positions Below pivot with targets at 0.71830 & 0.71460 in extension.
Alternative Price Action: Above pivot looks for a further Upside with 0.72710 & 0.73070 as targets.
Comment: Pair below 55MA and RSI at 50 levels.
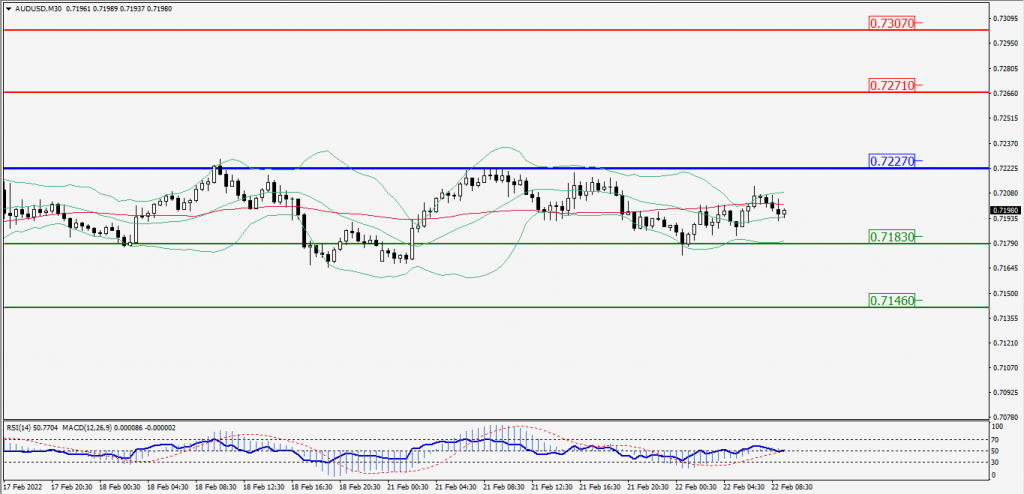
Green Lines Indicate Resistance Levels – Red Lines Indicates Support Levels
Light Blue is a Pivot Point – Black represents the price when the report was produced
CRUDEOIL Intraday: Trend On the Upside
Our pivot point is at 92.40
Preferable Price Action: Above pivots Buy Oil with 94.10 & 95.40 as targets.
Alternative Price Action: Sell crude Below pivot with targets at 90.70 and 89.30 in extension.
Comment: MACD is in the Positive territory and Pair Above its 20MA & 55MA.
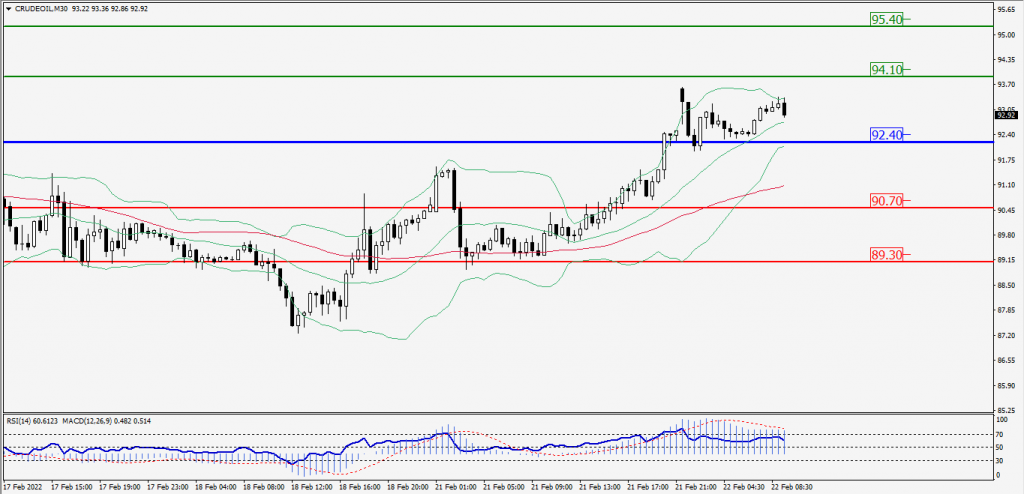
Green Lines Indicate Resistance Levels – Red Lines Indicates Support Levels
Light Blue is a Pivot Point – Black represents the price when the report was produced
XAU/USD Intraday: Support Level at 1906.40
Our pivot point is 1906.40
Preferable Price Action: Further Upside to 1917.10 and 1925.80.
Alternative Price Action: If the price gives an Upside breakout of a pivot, then the price extends to 1895.70 and 1886.70.
Comment: MACD is a Positive territory And Price Above its 20MA & 55MA.
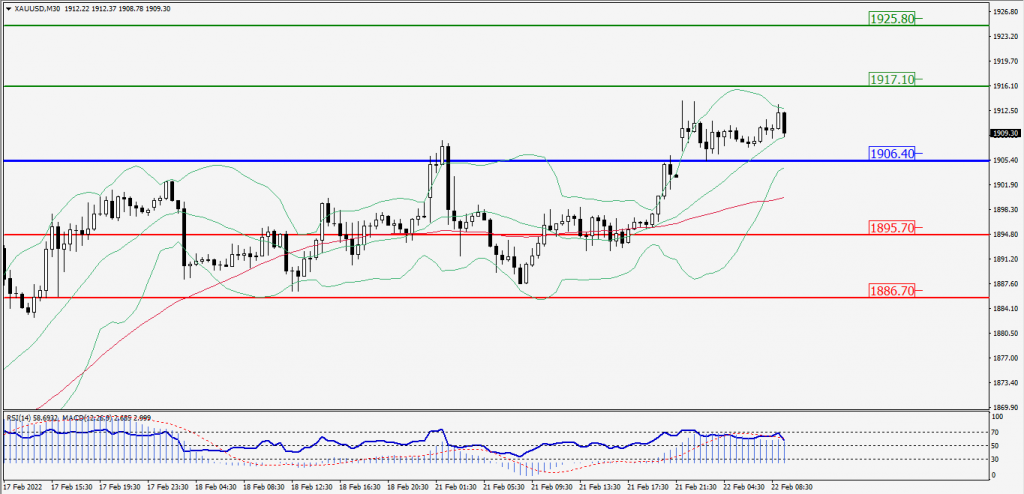
Green Lines Indicate Resistance Levels – Red Lines Indicates Support Levels
Light Blue is a Pivot Point – Black represents the price when the report was produced
Dow Jones Intraday: Major Trend on the Downside
Our pivot point is 33,804.00
Preferable Price Action: Take Short positions Below pivot with targets at 33,449.00 & 33,176.00.
Alternative Price Action: Above 33,804.00 looks for further Upside to 34,163.00 & 34,427.00.
Comment: RSI Below 50 levels And Price Below 20MA & 55MA.
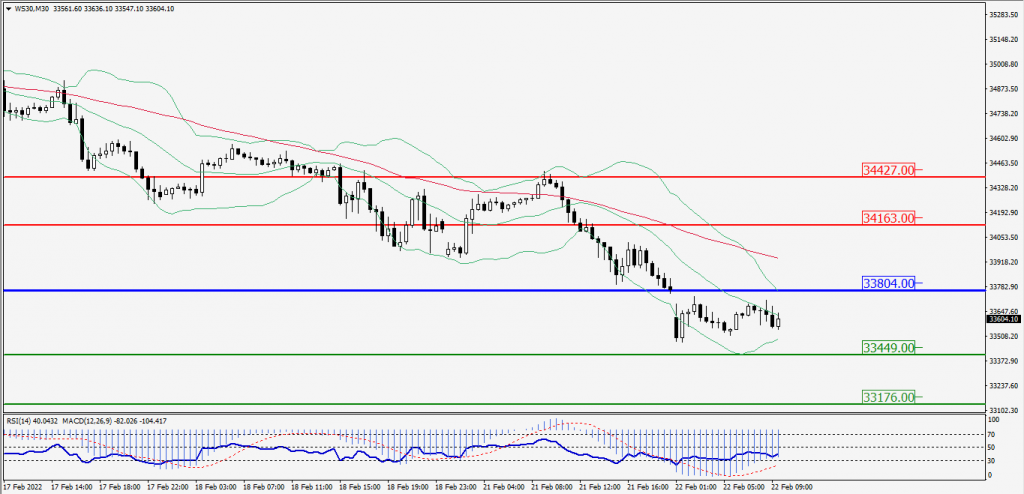
Green Lines Indicate Resistance Levels – Red Lines Indicates Support Levels
Light Blue is a Pivot Point – Black represents the price when the report was produced