Market Wrap: Stocks, Bonds, Commodities
Wall Street’s major indices ended sharply lower on Wednesday, extending their recent rout as Ukraine declared a state of emergency and the US State Department said a Russian invasion of Ukraine remains potentially imminent.
The S&P 500 Lost (1.84%) ended at 4,225.50 points, while the Nasdaq Composite fell 2.57% to 13,037.49. The Dow Jones Industrial was down 1.38% to 33,131.76.
MSCI’s index of Asia-Pacific stocks outside Japan is fell 3.38%, to 739.32 levels. Australian index down 2.99% to 6,990.60. Japanese Nikkei Index fell 1.81% to 25,970.82.
European stocks were mixed on Thursday, with the Stoxx Europe 50 Index dropped 4.17% to 3.807.65 Germany’s DAX lost 4.38% to 13,990.41, and France’s CAC pulled down 4.02% to 6,508.16, and U.K.’s FTSE 100 down 3.06% to 7,268.60.
Benchmark 10-year U.S. Treasury fell as demand for safe assets lost again, today 10-year bond yields a negative 1.878.
Oil prices steadied on Wednesday, holding below 2014 highs, as US officials indicated escalation between Russia and Ukraine was unlikely to result in sanctions on energy supplies from Russia, one of the world’s top oil producers.
Spot Brent crude oil rose 6.20% to $99.88 per barrel. US West Texas Intermediate crude up 6.44% to $98.03 a barrel.
The yellow metal gold is climbed 1.78% to 1,944.45 dollars per ounce.
Market Wrap: Forex
The dollar was up on Thursday morning in Asia, with the euro weakening and increased demand for safe-haven currencies as concerns of an imminent Russian invasion of Ukraine intensify.
Today, the U.S. dollar index measures the Greenback against a trade-weighted basket of six major currencies, which is rose 0.46% today to 96.635.
The Euro US Dollar (EUR/USD) is a widely traded pair that is negative today. This left the pair trading around $1.12460.
The Japanese yen was neutral against the U.S. dollar on Thursday as the stock constant. Today USD/JPY is fell 0.45% to 114.450 level.
Another commodity-related currency negative against the U.S dollar, AUD/USD down 0.82% to 0.71740, and NZD/USD lost 0.92% to 0.67100 level.
EUR/USD Intraday: Trend on the Downside
Our pivot point is at 1.12780
Preferable Price Action: Take Short positions Below pivot level with targets at 1.12190 & 1.11710 in extension.
Alternative Price Action: Above pivot looks for a further Upside to 1.13350 & 1.13820.
Comment: RSI below 50 levels and Pair Below its 55MA & 20MA.
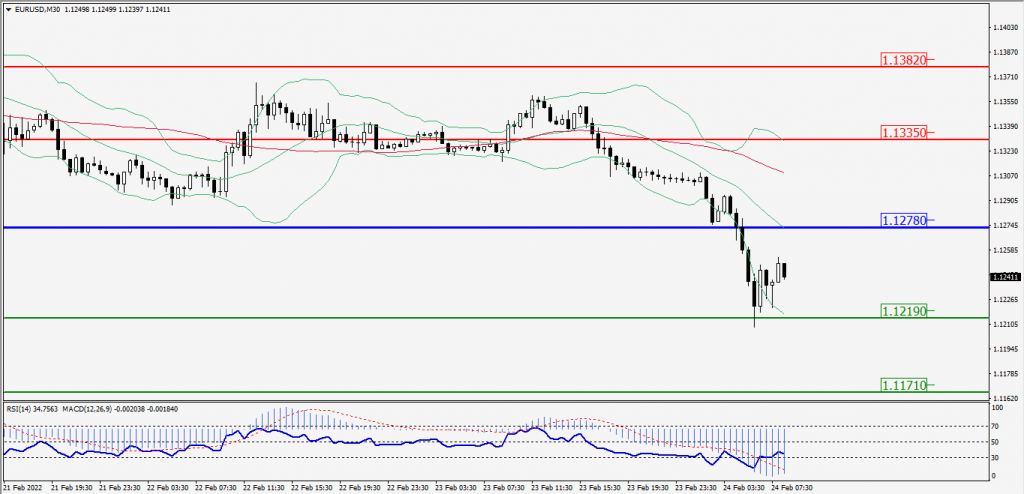
Green Lines Indicate Resistance Levels – Red Lines Indicates Support Levels
Light Blue is a Pivot Point – Black represents the price when the report was produced
GBP/USD Intraday: Trend On the Downside
Our pivot point is at 1.35330
Preferable Price Action: Sell positions Below pivot with targets at 1.34920 & 1.34590 in extension.
Alternative Price Action: The price Above pivot would call for further Upside to 1.35710 & 1.36050.
Comment: RSI Below 50 levels and Pair Below its 55MA & 20MA.
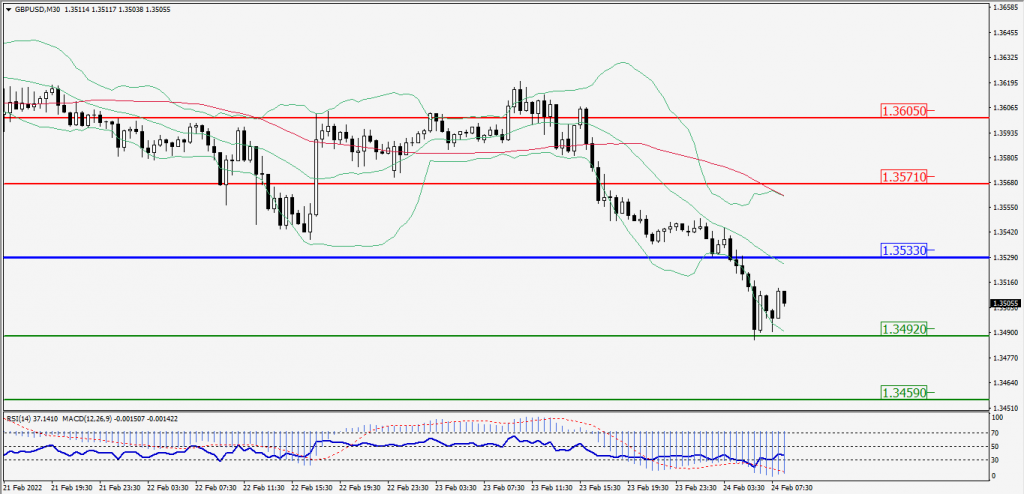
Green Lines Indicate Resistance Levels – Red Lines Indicates Support Levels
Light Blue is a Pivot Point – Black represents the price when the report was produced
USD/JPY Intraday: Support Level at 114.680
Our pivot point is at 114.680
Preferable Price Action: Sell position Below pivot with the target at 114.380 and 114.120 in extension.
Alternative Price Action: The Upside breakout of the pivot would call for 114.990 and 115.240.
Comment: MACD in Negative territory and Pair Below its 20MA & 55MA.
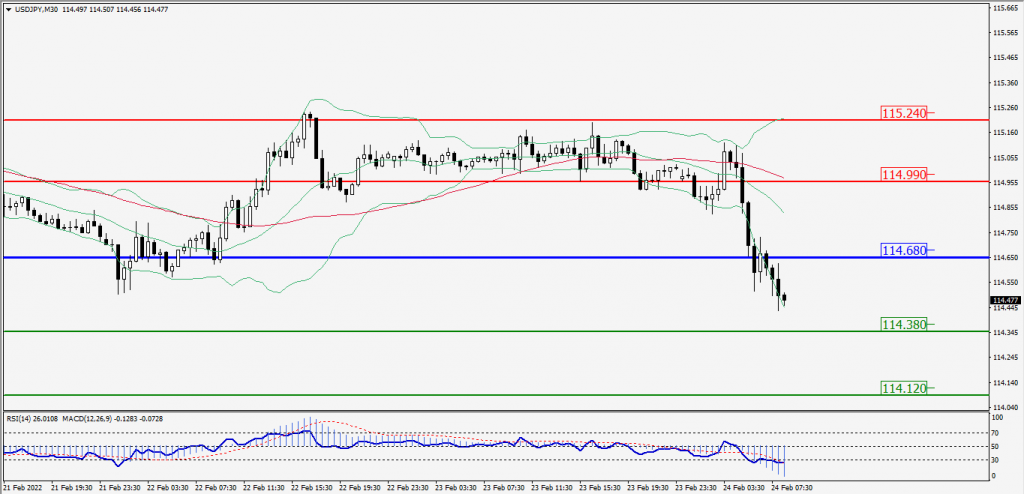
Green Lines Indicate Resistance Levels – Red Lines Indicates Support Levels
Light Blue is a Pivot Point – Black represents the price when the report was produced
AUD/USD Intraday: Resistance Level at 0.72040
Our pivot point is at 0.72040
Preferable Price Action: Sell Positions Below pivot with targets at 0.71530 & 0.71130 in extension.
Alternative Price Action: Above pivot looks for a further Upside with 0.72510 & 0.72920 as targets.
Comment: Pair Below its 20MA & 55MA and RSI below 50 levels.
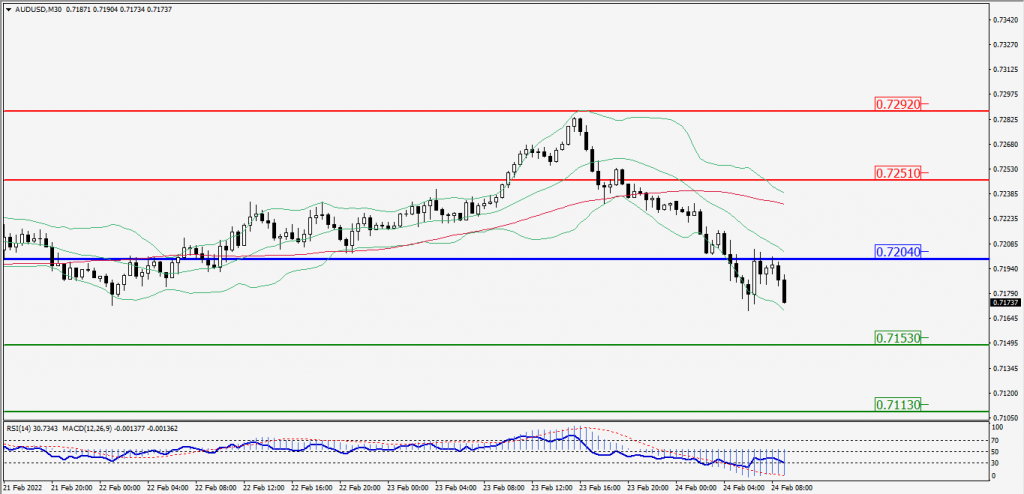
Green Lines Indicate Resistance Levels – Red Lines Indicates Support Levels
Light Blue is a Pivot Point – Black represents the price when the report was produced
CRUDEOIL Intraday: Trend On the Upside
Our pivot point is at 95.70
Preferable Price Action: Above pivots Buy Oil with 98.00 & 99.70 as targets.
Alternative Price Action: Sell crude Below pivot with targets at 93.45 and 91.65 in extension.
Comment: MACD is in the Positive territory and Pair Above its 20MA & 55MA.
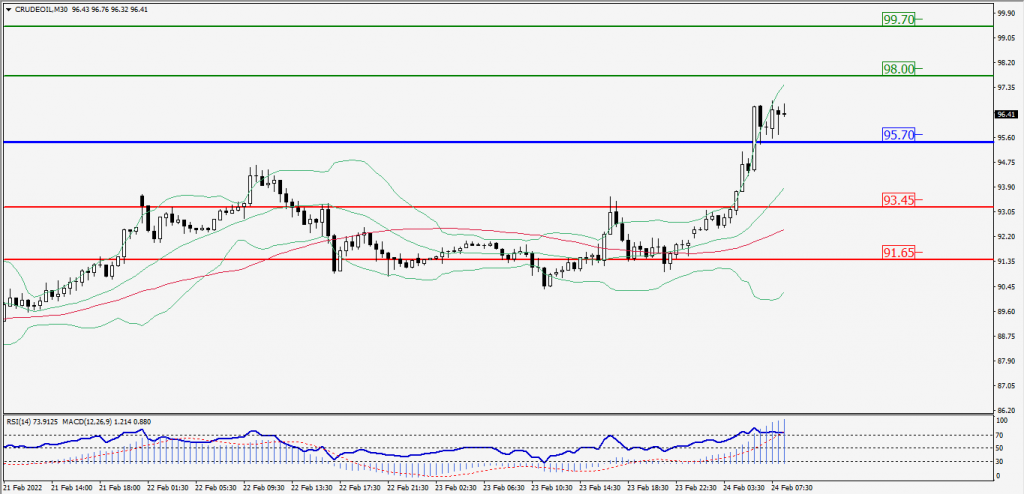
Green Lines Indicate Resistance Levels – Red Lines Indicates Support Levels
Light Blue is a Pivot Point – Black represents the price when the report was produced
XAU/USD Intraday: Trend on the Upside
Our pivot point is 1930.90
Preferable Price Action: Further Upside to 1949.70 and 1966.40.
Alternative Price Action: If the price gives a Downside breakout of a pivot, then the price extends to 1911.10 and 1895.60.
Comment: MACD is a Positive territory And Price Above its 20MA & 55MA.
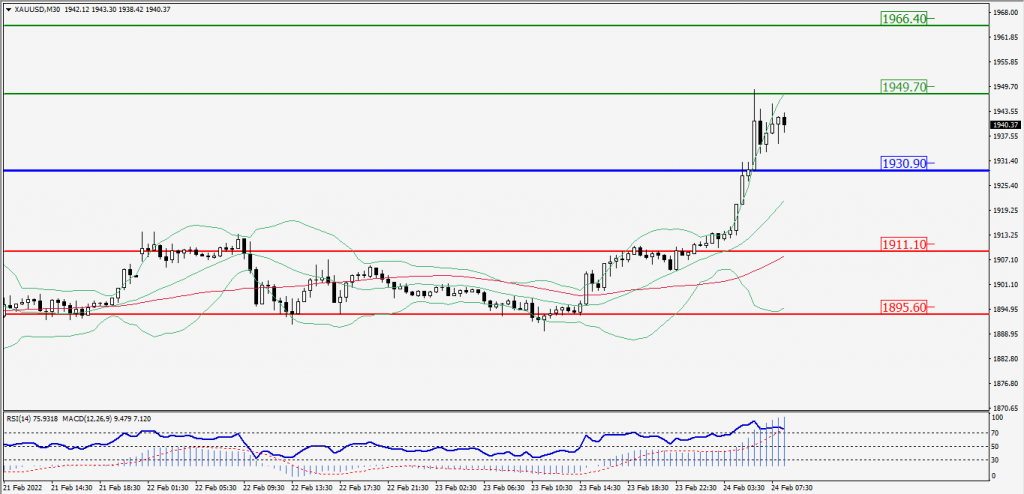
Green Lines Indicate Resistance Levels – Red Lines Indicates Support Levels
Light Blue is a Pivot Point – Black represents the price when the report was produced
Dow Jones Intraday: Major Trend on the Downside
Our pivot point is 32,910.00
Preferable Price Action: Take Short positions Below pivot with targets at 31,856.00 & 31,000.00.
Alternative Price Action: Above 32,910.00 looks for further Upside to 33,954.00 & 34,789.00.
Comment: Price Below its 20MA & 55MA and RSI below 50 levels.
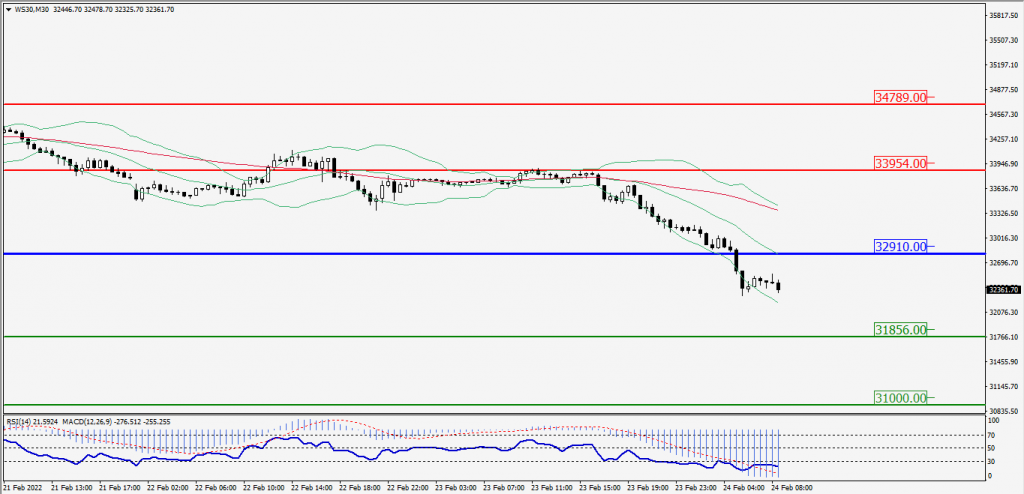
Green Lines Indicate Resistance Levels – Red Lines Indicates Support Levels
Light Blue is a Pivot Point – Black represents the price when the report was produced