Market Wrap: Stocks, Bonds, Commodities
US major indices advanced on Wednesday with the Dow Jones industrial touched record high as traders expect better than expected third-quarter earnings from U.S. companies.
The Dow Jones Industrial Average gained 152.03 points (0.43%) to 35,609.34, the S&P 500 advance 16.56 points (0.37%) to 4,536.19 and the Nasdaq Composite slipped (0.05%) to 15,121.68.
MSCI’s index of Asia-Pacific stocks outside Japan is fell 0.53% to 827.45 levels. Australian index rose 0.05% to 7,415.40. Japanese Nikkei Index fell 1.87% to 28,708.55.
European stocks were lower on Thusday, with the Stoxx Europe 50 Index falling 0.28% to 4,160.45, Germany’s DAX lost 0.15% to 15,500.30, and France’s CAC slipped 0.35% to 6,682.50, and U.K.’s FTSE 100 down 0.38% to 7,196.00.
Benchmark 10-year U.S. Treasury rose as demand for safe assets grows again, today 10-year bond yields gained 0.36% to 1.641.
crude oil prices jumped after crude inventories number come up lower than expected.
Spot Brent crude oil lost 0.71% to $85.21 per barrel. US West Texas Intermediate crude dropped 0.44% to $83.05 a barrel.
The yellow metal traded 0.10% higher to 1786.65 dollars per ounce.
Market Wrap: Forex
Today, the U.S. dollar index measures the greenback against a trade-weighted basket of six major currencies, which gained 0.06% to 93.593.
The Euro US Dollar (EUR/USD) is a widely traded pair that is rose 0.05% today. This left the pairing trading around $1.16510.
The Japanese yen rose against the U.S. dollar on Thursday as the stock pushes higher. Today US/JPY is down 0.30% to 113.930 level.
Another commodity-related currency lower against the U.S dollar, AUD/USD fell 0.30% to 0.74920, and NZD/USD lost 0.24% to 0.71820 level.
EUR/USD Intraday: Support at 1.16180
Our pivot point is at 1.16180
Preferable Price Action: Take long positions above pivot level with targets at 1.16780 & 1.17100 in extension.
Alternative Price Action: Below pivot looks for a further downside to 1.15700 & 1.15430.
Comment: Pair below its 55MA & 20MA and RSI below 50 levels.
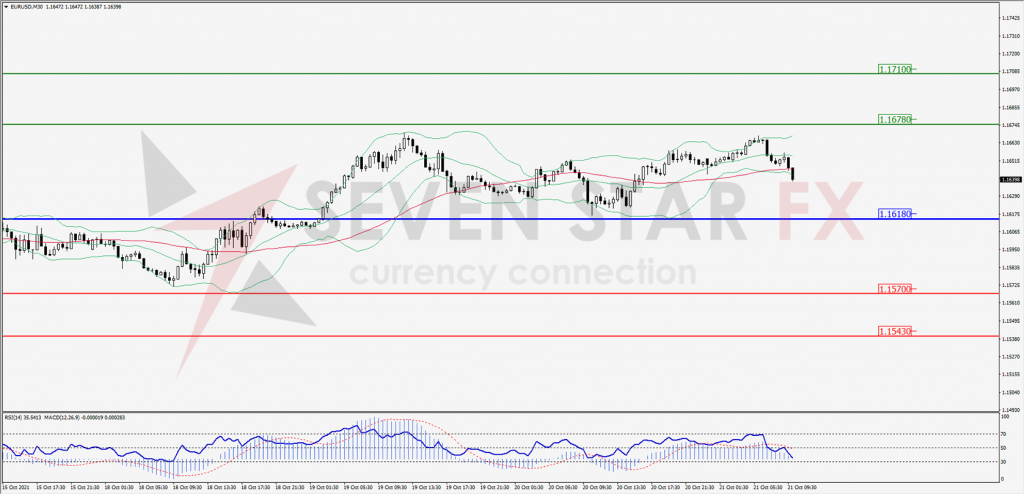
Green Lines Indicate Resistance Levels – Red Lines Indicates Support Levels
Light Blue is a Pivot Point – Black represents the price when the report was produced
GBP/USD Intraday: Trend on the upside
Our pivot point is at 1.37550
Preferable Price Action: Buy positions above pivot with targets at 1.38440 & 1.38800 in extension.
Alternative Price Action: The price below pivot would call for further downside to 1.36710 & 1.36300.
Comment: Pair below its 50MA & 20MA and RSI below 50 levels.
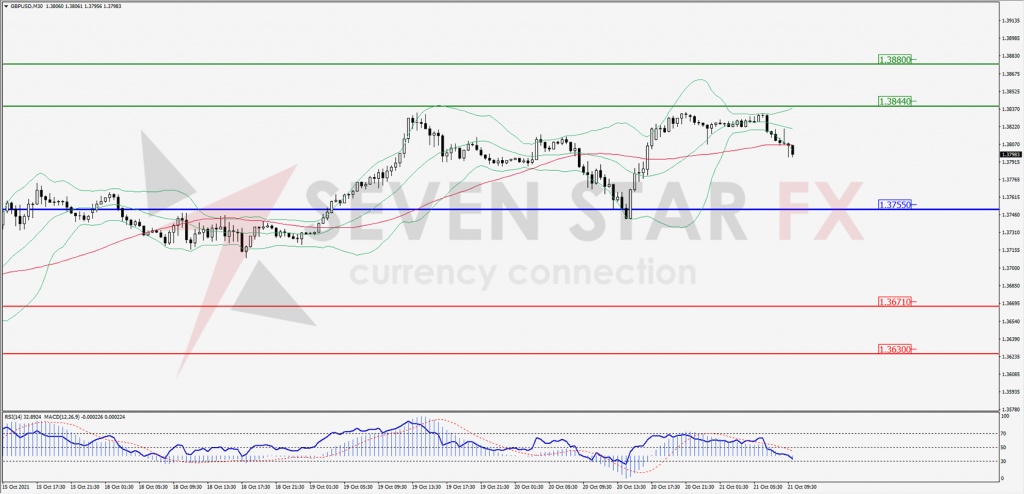
Green Lines Indicate Resistance Levels – Red Lines Indicates Support Levels
Light Blue is a Pivot Point – Black represents the price when the report was produced
USD/JPY Intraday: Resistance at 114.240
Our pivot point is at 114.240
Preferable Price Action: Sell position above pivot with the target at 113.580 and 113.300 in extension.
Alternative Price Action: The Upside breakout of the pivot would call for 114.910 and 115.220.
Comment: Price below its 55MA & 20MA and MACD in negative territory.
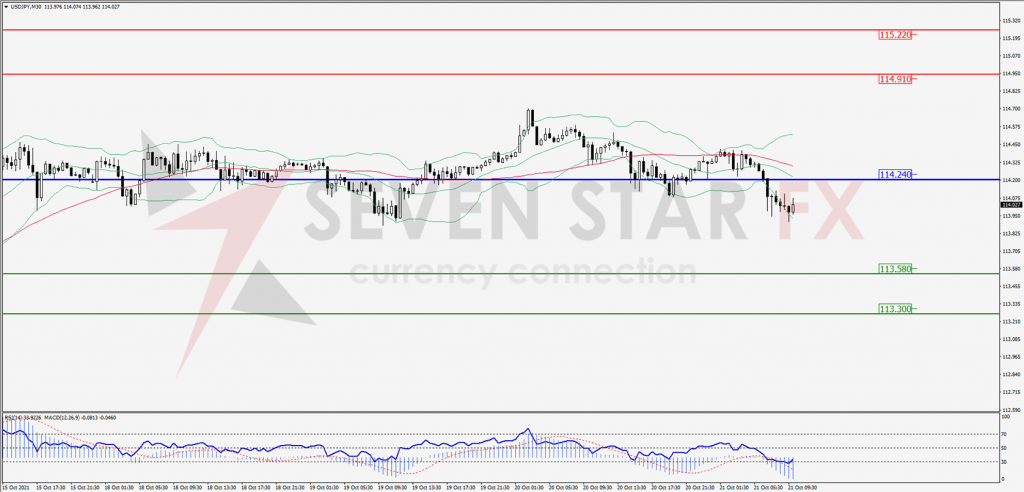
Green Lines Indicate Resistance Levels – Red Lines Indicates Support Levels
Light Blue is a Pivot Point – Black represents the price when the report was produced
AUD/USD Intraday: Trend on the upside
Our pivot point is at 0.74690
Preferable Price Action: Buy Positions above pivot with targets at 0.75250 & 0.75530 in extension.
Alternative Price Action: Below pivot looks for a further downside with 0.74120 & 0.73840 as targets.
Comment: Pair below its 55MA & 20MA and RSI below 50 levels.
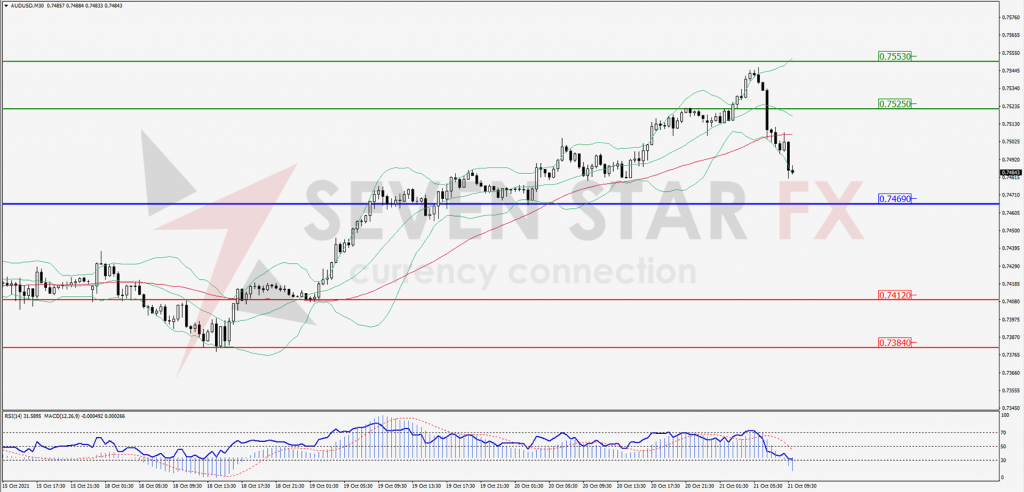
Green Lines Indicate Resistance Levels – Red Lines Indicates Support Levels
Light Blue is a Pivot Point – Black represents the price when the report was produced
CRUDEOIL Intraday: In a consolidation zone
Our pivot point is at 82.00
Preferable Price Action: Above pivots Buy Oil with 84.00 & 85.00 as targets.
Alternative Price Action: Buy crude Above pivot with targets at 80.00 and 79.00 in extension.
Comment: Crude is above its 55MA & 20MA and MACD in the positive territory.
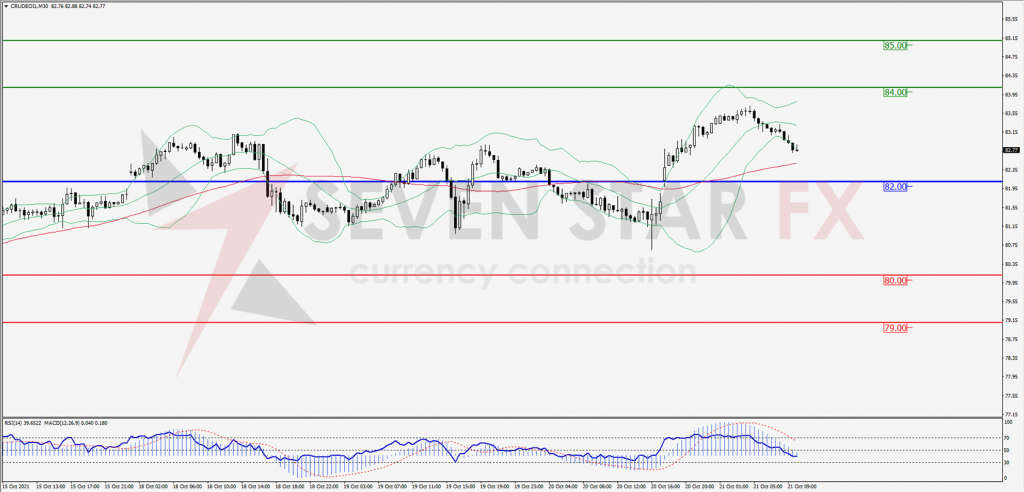
Green Lines Indicate Resistance Levels – Red Lines Indicates Support Levels
Light Blue is a Pivot Point – Black represents the price when the report was produced
XAU/USD Intraday: In a consolidation zone
Our pivot point is 1775.00
Preferable Price Action: Further upside to 1795.00 and 1805.00.
Alternative Price Action: If the price gives a downside breakout of a pivot, then the price extends to 1750.00 and 1735.00.
Comment: MACD in positive territory and price above its 20MA & 55MA.
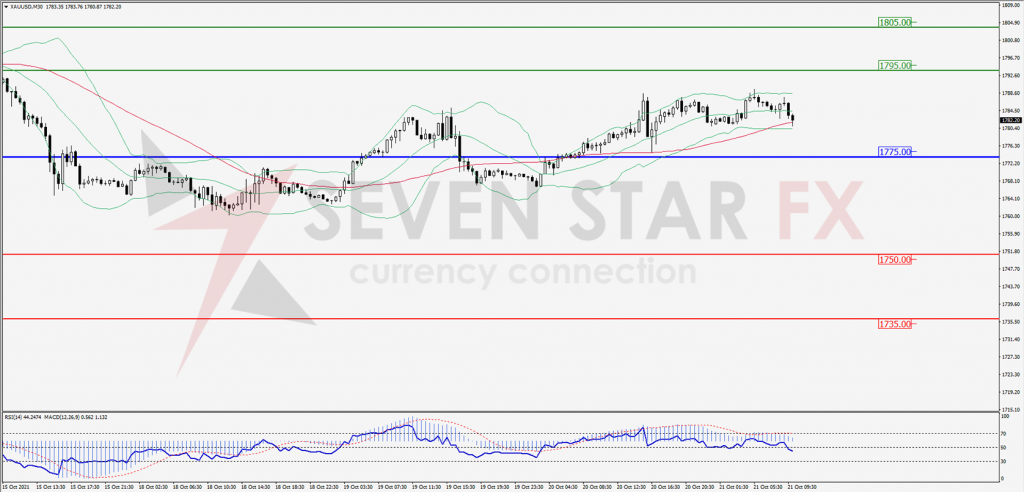
Green Lines Indicate Resistance Levels – Red Lines Indicates Support Levels
Light Blue is a Pivot Point – Black represents the price when the report was produced
Dow Jones Intraday: Trend on the upside
Our pivot point is 35,250.00
Preferable Price Action: Take long positions above pivot with targets at 35,680.00 & 35,910.00.
Alternative Price Action: Below 35,250.00 looks for further downside to 34,880.00 & 34,670.00.
Comment: Price above its 55MA & 20MA and RSI above 50 levels.
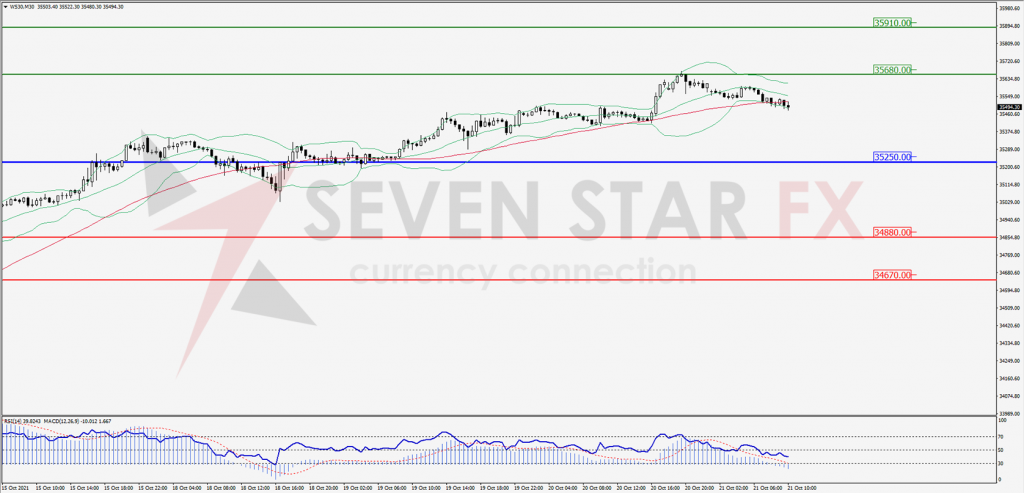
Green Lines Indicate Resistance Levels – Red Lines Indicates Support Levels
Light Blue is a Pivot Point – Black represents the price when the report was produced