Market Wrap: Stocks, Bonds, Commodities
Most Asian currencies were muted on Friday as the U.S. dollar remained near a 13-month high, while the Japanese yen steadied after consumer inflation came in slightly above expectations.
The Dow Jones Industrial Average rose 461.88 points to 43,870.35, the S&P 500 gain 0.53% to 5,948.70 and the Nasdaq Composite up 6.28 points to 18,972.42.
MSCI’s index of Asia-Pacific stocks outside Japan is down 0.76% to 706.52 levels. The Australian index was higher by 0.85% to 8,393.80. Japanese Nikkei Index increase 0.84% today.
European stocks were positive on Friday, with the Stoxx Europe 50 Index increase 0.59% to 4,757.45 Germany’s DAX ascend 0.74% to 19.146.17, and France’s CAC higher 0.21% to 7,213.32 and U.K.’s FTSE 100 gain 0.79% to 8,149.27.
Benchmark 10-year U.S. Treasury fail as demand for safe assets slipped again, today 10-year bond yields 0.47% to 4.4130.
Oil prices extended gains on Friday, heading for a weekly uptick of more than 4%, as the Ukraine war intensified with Russian President Vladimir Putin warning of a global conflict.
Spot Brent crude oil increase 0.20% to $74.38 per barrel. US West Texas Intermediate crude is increase 0.26% to $70.28 a barrel.
The yellow metal gold is up 0.71% to 2,693.90 dollars per ounce.
Market Wrap: Forex
The Nasdaq rose more than 1% and S&P 500 also ended higher on Friday, led by a jump in technology shares as investors eagerly awaited results this week from Nvidia, while Walmart shares climbed after the retailer raised its annual forecasts. The Dow finished lower.
Today, the U.S. dollar index measures the Greenback against a trade-weighted basket of six major currencies, which either ascend 0.18% to 107.160.
The Euro US Dollar (EUR/USD) is a widely traded is down 0.06% today. This left the pair trading around $1.04670.
The Japanese yen was will move positive against the U.S. dollar on Friday. Today USD/JPY is trades pair that increase 0.17% to the 154.78 level.
Another commodity-related currency negative against the U.S dollar, AUD/USD loss 0.26% to 0.64940, and NZD/USD decrease 0.43% to 0.58340 level.
EUR/USD Intraday: Trend on the downside
Our pivot point is at 1.04770
Preferable Price Action: Take sell positions below pivot level with targets at 1.04490 & 1.04240 in extension.
Alternative Price Action: Buy pivot looks for a further upside to 1.05050 & 1.05310.
Comment: RSI is below 50 levels and pairs below its 55MA & 20MA.
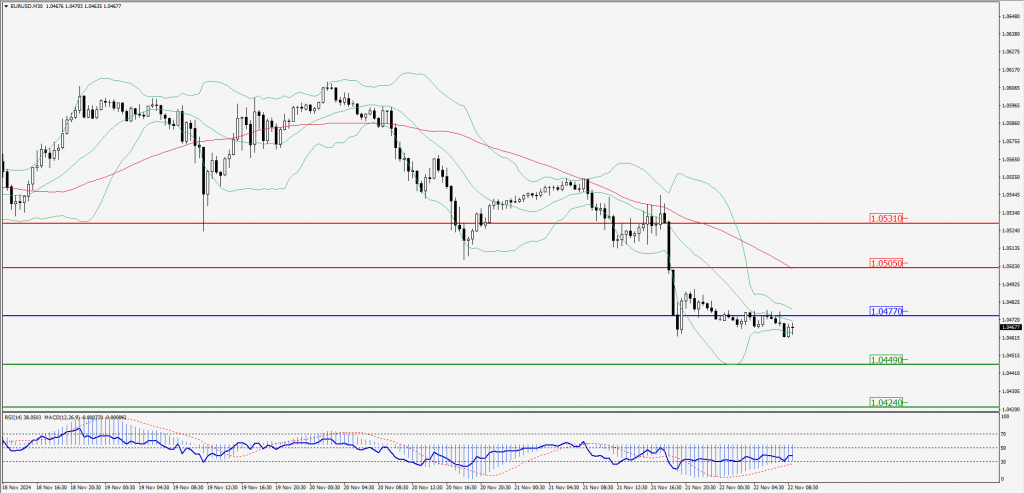
Green Lines Indicate Resistance Levels – Red Lines Indicate Support Levels
Light Blue is a Pivot Point – Black represents the price when the report was produced
GBP/USD Intraday: Major trend on the downside
Our pivot point is at 1.25770
Preferable Price Action: Sell positions below pivot with targets at 1.25530 & 1.25290 in extension.
Alternative Price Action: The price above pivot would call for further upside to 1.26010 & 1.26240.
Comment: RSI is below 50 levels and pairs below its 55MA & 20MA.
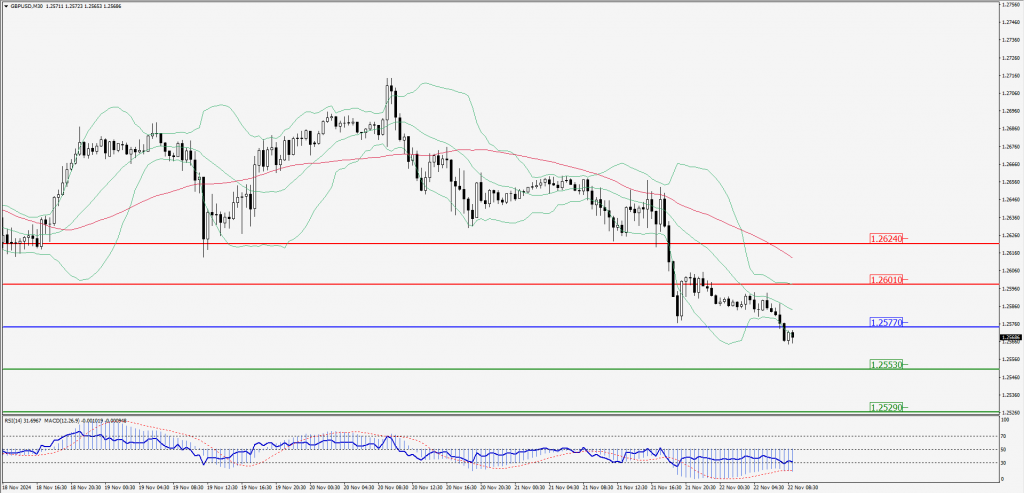
Green Lines Indicate Resistance Levels – Red Lines Indicate Support Levels
Light Blue is a Pivot Point – Black represents the price when the report was produced
USD/JPY Intraday: Trend on the upside
Our pivot point is at 154.870
Preferable Price Action: Buy position above pivot with the target at 155.200 and 155.500 in extension.
Alternative Price Action: The downside breakout of the pivot would call for 154.540 and 154.240.
Comment: MACD is above 50 levels and pairs above its 55MA & 20MA.
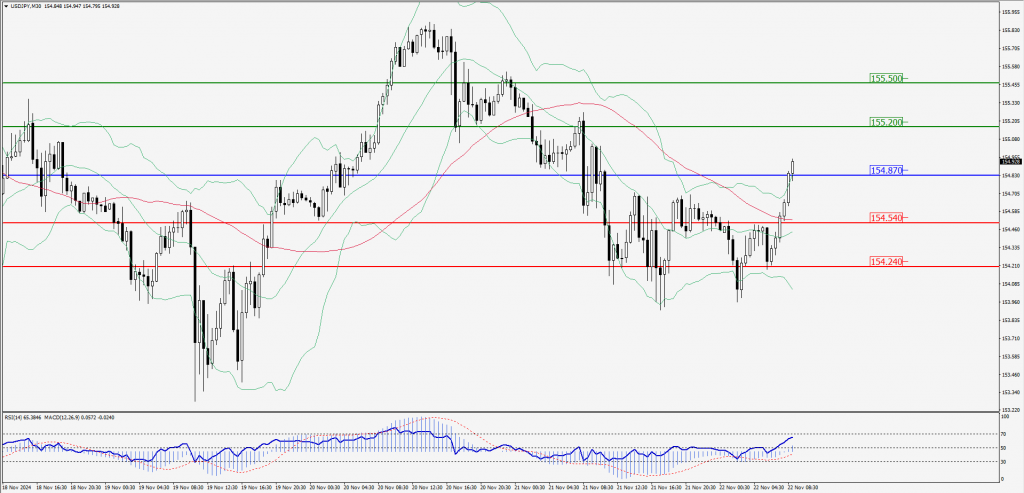
Green Lines Indicate Resistance Levels – Red Lines Indicate Support Levels
Light Blue is a Pivot Point – Black represents the price when the report was produced
AUD/USD Intraday: Major trend on the downside
Our pivot point is at 0.64950
Preferable Price Action: Sell positions below pivot with targets at 0.64820 & 0.64700 in extension.
Alternative Price Action: Above pivot a further upside with 0.65070 & 0.65190 as targets.
Comment: RSI is below 50 levels and pairs below its 55MA & 20MA.
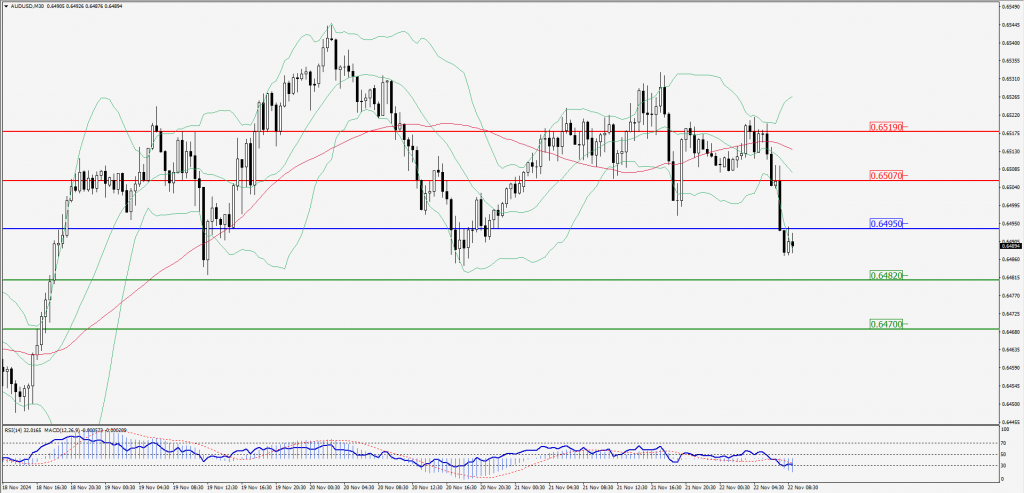
Green Lines Indicate Resistance Levels – Red Lines Indicate Support Levels
Light Blue is a Pivot Point – Black represents the price when the report was produced
CRUDEOIL Intraday: Trend on the upside
Our pivot point is at 70.03
Preferable Price Action: Above pivot buy oil with 70.51 & 70.98 as targets.
Alternative Price Action: Sell crude below pivot with targets at 69.59& 69.15 in extension.
Comment: RSI is at above 50 levels and pairs above its 55MA.
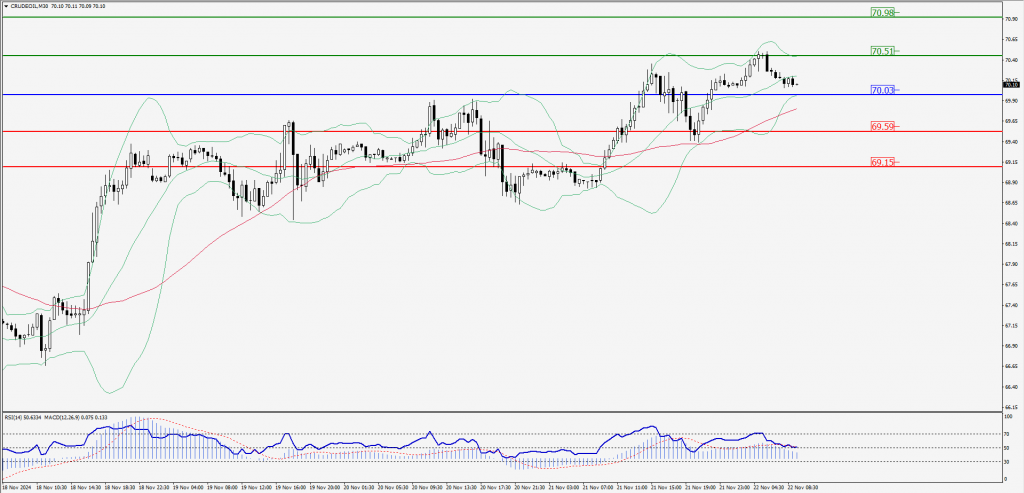
Green Lines Indicate Resistance Levels – Red Lines Indicate Support Levels
Light Blue is a Pivot Point – Black represents the price when the report was produced
XAU/USD Intraday: Trend on the upside
Our pivot point is at 2685.40
Preferable Price Action: Further upside to 2704.30 and 2719.80.
Alternative Price Action: If the price gives an downside breakout of a pivot, then the price extends to 2667.20 and 2651.30.
Comment: MACD is above 50 levels and pairs above its 20MA & 55MA.
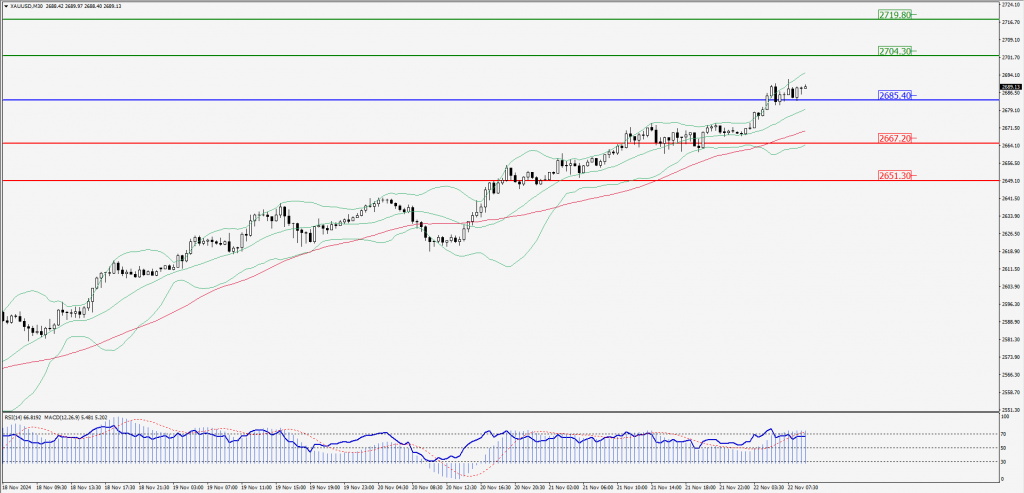
Green Lines Indicate Resistance Levels – Red Lines Indicate Support Levels
Light Blue is a Pivot Point – Black represents the price when the report was produced
Dow Jones Intraday: Trend on the upside
Our pivot point is 43,861.40
Preferable Price Action: Take buy positions above the pivot with targets at 44,000.00 & 44,125.70.
Alternative Price Action: Below 43,861.40 looks for further downside to 43,711.60 & 43,576.70.
Comment: RSI is above 50 levels and pairs above its 55MA.
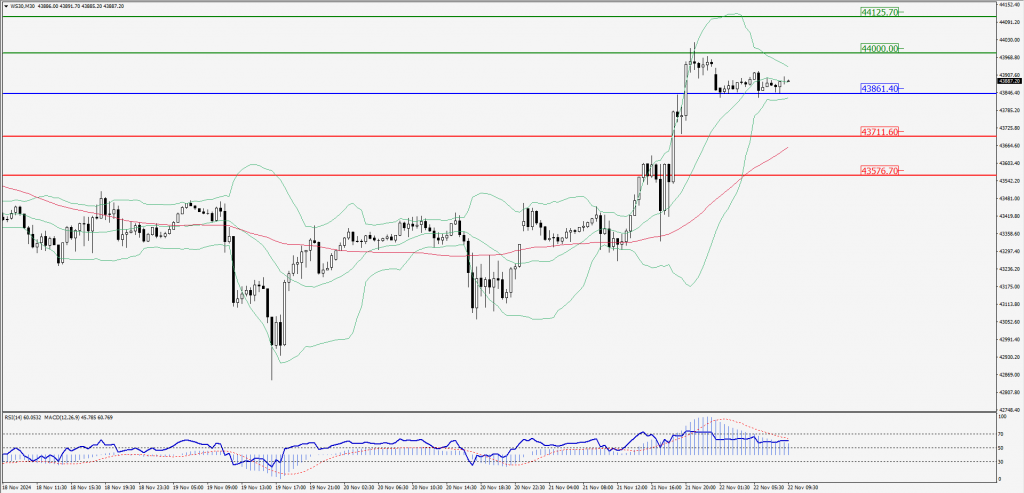
Green Lines Indicate Resistance Levels – Red Lines Indicate Support Levels
Light Blue is a Pivot Point – Black represents the price when the report was produced