Market Wrap: Stocks, Bonds, Commodities
Most Asian currencies nursed losses on Thursday, while the dollar remained close to one-year highs amid growing doubts over whether the Federal Reserve will cut interest rates in December.
The Dow Jones Industrial Average rose 139.53 points to 43,408.47, the S&P 500 gain 0.01% to 5,917.11 and the Nasdaq Composite down 21.33 points to 18,966.14.
MSCI’s index of Asia-Pacific stocks outside Japan is down 0.66% to 708.03 levels. The Australian index was lower by 0.04% to 8,323.00. Japanese Nikkei Index decrease 0.97% today.
European stocks were negative on Thursday, with the Stoxx Europe 50 Index decrease 0.42% to 4,731.15 Germany’s DAX descend 0.29% to 19.004.78, and France’s CAC lower 0.43% to 7,198.45 and U.K.’s FTSE 100 loss 0.17% to 8,085.07.
Benchmark 10-year U.S. Treasury rose as demand for safe assets slipped again, today 10-year bond yields 0.09% to 4.4100.
Oil prices rose marginally on Thursday as geopolitical concerns over escalating tensions between Russia and Ukraine countered the impact from a bigger-than-expected increase in U.S. crude inventories.
Spot Brent crude oil increase 0.67% to $73.30 per barrel. US West Texas Intermediate crude is increase 0.73% to $69.25 a barrel.
The yellow metal gold is up 0.42% to 2,662.75 dollars per ounce.
Market Wrap: Forex
The U.S. dollar rose on Thursday, renewing its post-election rally after a three-session decline as investors looked for more insight on the Federal Reserve’s interest rate plans and U.S. President-elect Donald Trump’s proposed policies.
Today, the U.S. dollar index measures the Greenback against a trade-weighted basket of six major currencies, which either descend 0.06% to 106.550.
The Euro US Dollar (EUR/USD) is a widely traded is down 0.01% today. This left the pair trading around $1.05420.
The Japanese yen was will move positive against the U.S. dollar on Thursday. Today USD/JPY is trades pair that decrease 0.35% to the 154.89 level.
Another commodity-related currency mixed against the U.S dollar, AUD/USD gain 0.18% to 0.65150, and NZD/USD decrease 0.10% to 0.58690 level.
EUR/USD Intraday: Trend on the downside
Our pivot point is at 1.05501
Preferable Price Action: Take sell positions below pivot level with targets at 1.05370 & 1.05239 in extension.
Alternative Price Action: Buy pivot looks for a further upside to 1.05640 & 1.05760.
Comment: RSI is below 50 levels.
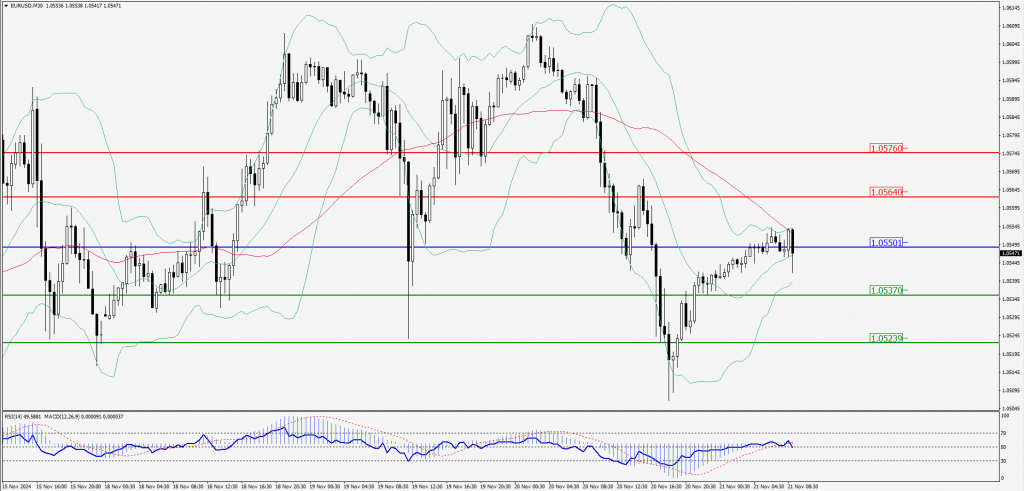
Green Lines Indicate Resistance Levels – Red Lines Indicate Support Levels
Light Blue is a Pivot Point – Black represents the price when the report was produced
GBP/USD Intraday: Trend on the downside
Our pivot point is at 1.26540
Preferable Price Action: Sell positions below pivot with targets at 1.26400 & 1.26260 in extension.
Alternative Price Action: The price above pivot would call for further upside to 1.26680 & 1.26820.
Comment: RSI is below 50 levels and pairs below its 55MA.
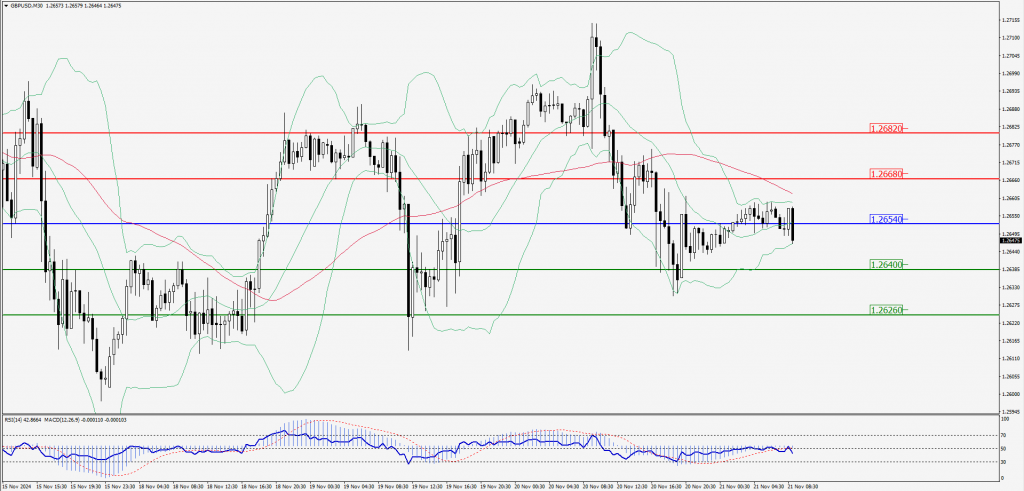
Green Lines Indicate Resistance Levels – Red Lines Indicate Support Levels
Light Blue is a Pivot Point – Black represents the price when the report was produced
USD/JPY Intraday: Trend on the downside
Our pivot point is at 154.810
Preferable Price Action: Sell position below pivot with the target at 154.460 and 154.130 in extension.
Alternative Price Action: The upside breakout of the pivot would call for 155.150 and 155.470.
Comment: MACD is below 50 levels and pairs below its 55MA.
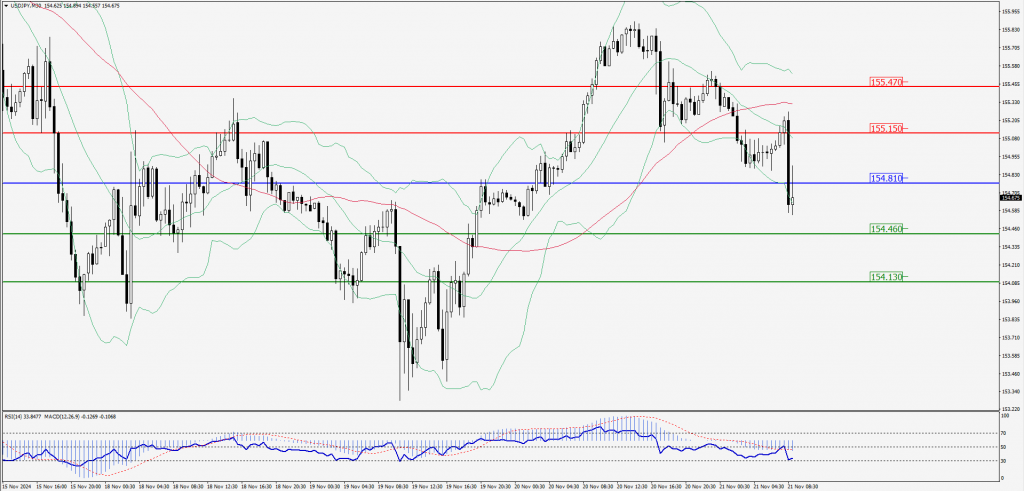
Green Lines Indicate Resistance Levels – Red Lines Indicate Support Levels
Light Blue is a Pivot Point – Black represents the price when the report was produced
AUD/USD Intraday: Trend on the upside
Our pivot point is at 0.65100
Preferable Price Action: Buy positions above pivot with targets at 0.65230 & 0.65350 in extension.
Alternative Price Action: Below pivot a further downside with 0.64980 & 0.64860 as targets.
Comment: RSI is above 50 levels and pairs above its 55MA.
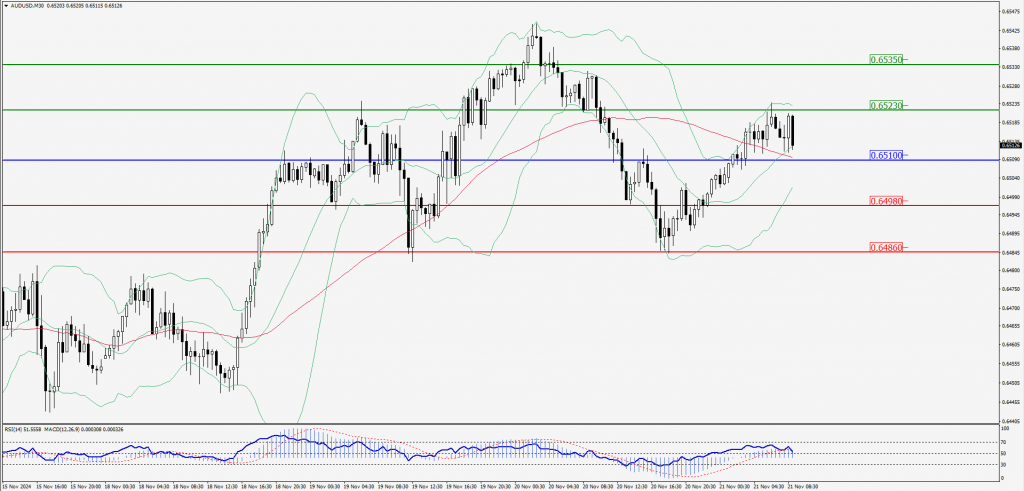
Green Lines Indicate Resistance Levels – Red Lines Indicate Support Levels
Light Blue is a Pivot Point – Black represents the price when the report was produced
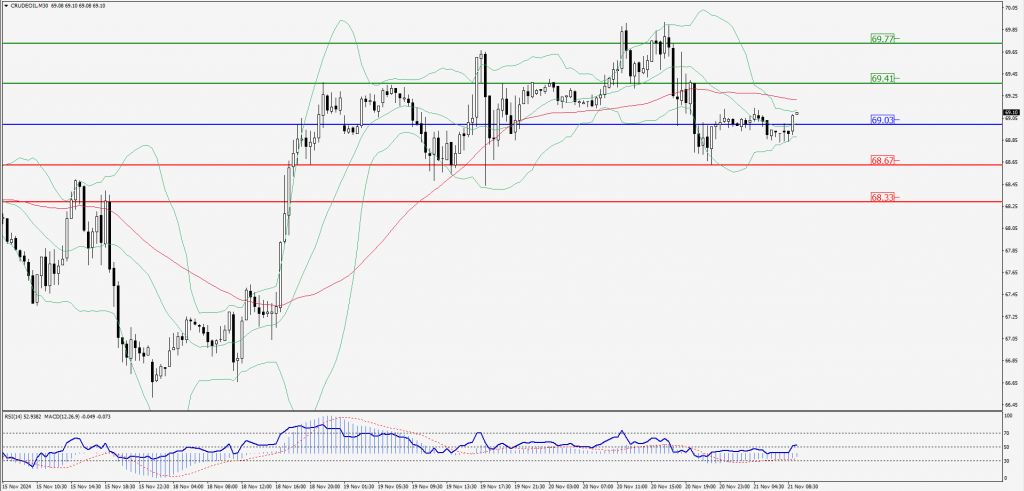
CRUDEOIL Intraday: Trend on the upside
Our pivot point is at 69.03
Preferable Price Action: Above pivot buy oil with 69.41 & 69.77 as targets.
Alternative Price Action: Sell crude below pivot with targets at 68.67 & 68.33 in extension.
Comment: RSI is at above 50 levels and pairs above its 20MA.
Green Lines Indicate Resistance Levels – Red Lines Indicate Support Levels
Light Blue is a Pivot Point – Black represents the price when the report was produced
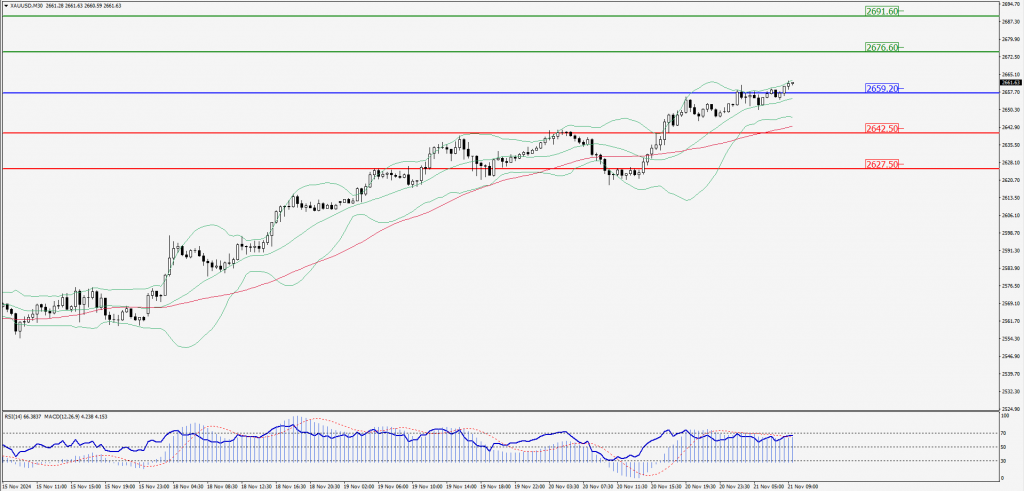
XAU/USD Intraday: Trend on the upside
Our pivot point is at 2659.20
Preferable Price Action: Further upside to 2676.60 and 2691.60.
Alternative Price Action: If the price gives an downside breakout of a pivot, then the price extends to 2642.50 and 2627.50.
Comment: MACD is above 50 levels and pairs above its 20MA & 55MA.
Green Lines Indicate Resistance Levels – Red Lines Indicate Support Levels
Light Blue is a Pivot Point – Black represents the price when the report was produced
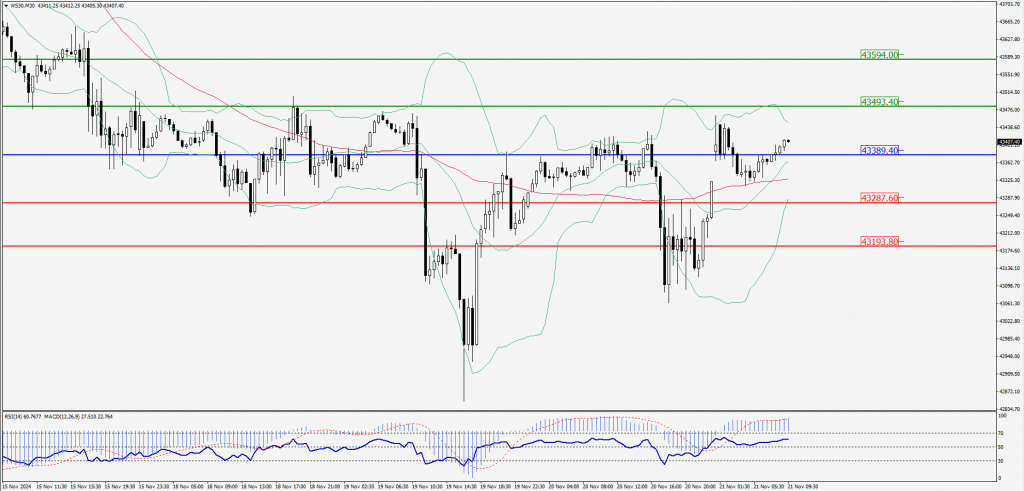
Dow Jones Intraday: Support level at 43,389.40
Our pivot point is 43,389.40
Preferable Price Action: Take buy positions above the pivot with targets at 43,493.40 & 43,594.00.
Alternative Price Action: Below 43,389.40 looks for further downside to 43,287.60 & 43,193.80.
Comment: RSI is above 50 levels and pairs above its 20MA & 55MA.
Green Lines Indicate Resistance Levels – Red Lines Indicate Support Levels
Light Blue is a Pivot Point – Black represents the price when the report was produced