Market Wrap: Stocks, Bonds, Commodities
Most Asian currencies inched up on Monday, while the Japanese yen firmed against the dollar as nomination of fund manager Scott Bessent as Treasury Secretary pulled U.S. bond yields lower and put the greenback on the backfoot.
The Dow Jones Industrial Average rose 426.16 points to 44,296.51, the S&P 500 gain 0.35% to 5,969.30 and the Nasdaq Composite up 31.23 points to 19,003.65.
MSCI’s index of Asia-Pacific stocks outside Japan is up 0.52% to 709.77 levels. The Australian index was higher by 0.28% to 8,417.60. Japanese Nikkei Index increase 1.08% today.
European stocks were positive on Monday, with the Stoxx Europe 50 Index increase 0.63% to 4,819.35 Germany’s DAX ascend 0.60% to 19.421.05, and France’s CAC higher 0.69% to 7,304.85 and U.K.’s FTSE 100 gain 0.43% to 8,297.88.
Benchmark 10-year U.S. Treasury fail as demand for safe assets slipped again, today 10-year bond yields 1.61% to 4.3390.
Oil prices slipped on Monday following 6% gains last week, but supply worries amid mounting tensions between Western powers and major oil producers Russia and Iran kept a floor under prices.
Spot Brent crude oil decrease 0.72% to $74.09 per barrel. US West Texas Intermediate crude is decrease 0.55% to $70.69 a barrel.
The yellow metal gold is up 1.52% to 2,695.70 dollars per ounce.
Market Wrap: Forex
The dollar relinquished a little of its recent gains on Monday as the pick for U.S. Treasury secretary seemed to reassure the bond market and pulled yields lower, shaving some of the currency’s rate advantage.
Today, the U.S. dollar index measures the Greenback against a trade-weighted basket of six major currencies, which either descend 0.31% to 107.170.
The Euro US Dollar (EUR/USD) is a widely traded is up 0.37% today. This left the pair trading around $1.04560.
The Japanese yen was will move negative against the U.S. dollar on Monday. Today USD/JPY is trades pair that decrease 0.10% to the 154.58 level.
Another commodity-related currency positive against the U.S dollar, AUD/USD gain 0.05% to 0.64040, and NZD/USD increase 0.12% to 0.58400 level.
EUR/USD Intraday: Trend on the downside
Our pivot point is at 1.04640
Preferable Price Action: Take sell positions below pivot level with targets at 1.04250 & 1.03920 in extension.
Alternative Price Action: Buy pivot looks for a further upside to 1.05030 & 1.05340.
Comment: RSI is below 50 levels and pairs below its 20MA.
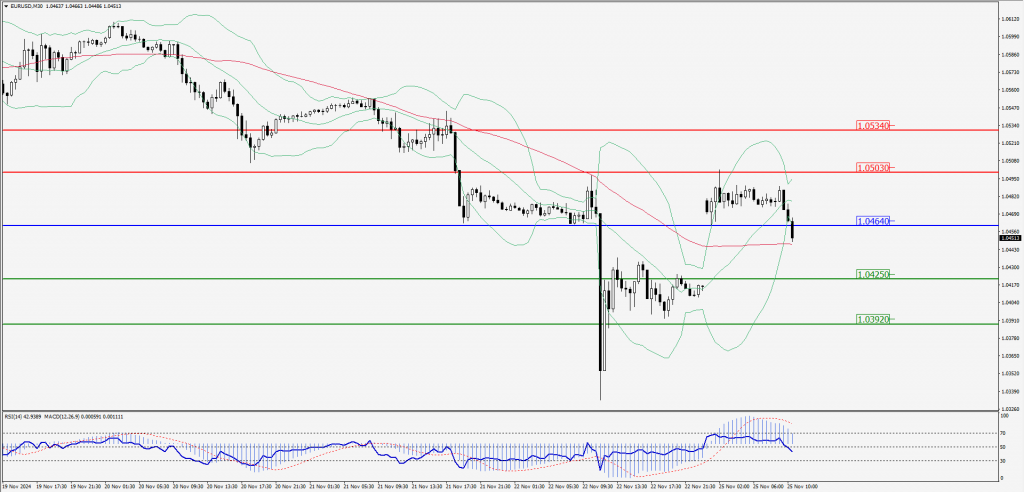
Green Lines Indicate Resistance Levels – Red Lines Indicate Support Levels
Light Blue is a Pivot Point – Black represents the price when the report was produced
GBP/USD Intraday: Trend on the downside
Our pivot point is at 1.25770
Preferable Price Action: Sell positions below pivot with targets at 1.25500 & 1.25260 in extension.
Alternative Price Action: The price above pivot would call for further upside to 1.26050 & 1.26270.
Comment: RSI is below 50 levels and pairs below its 20MA.
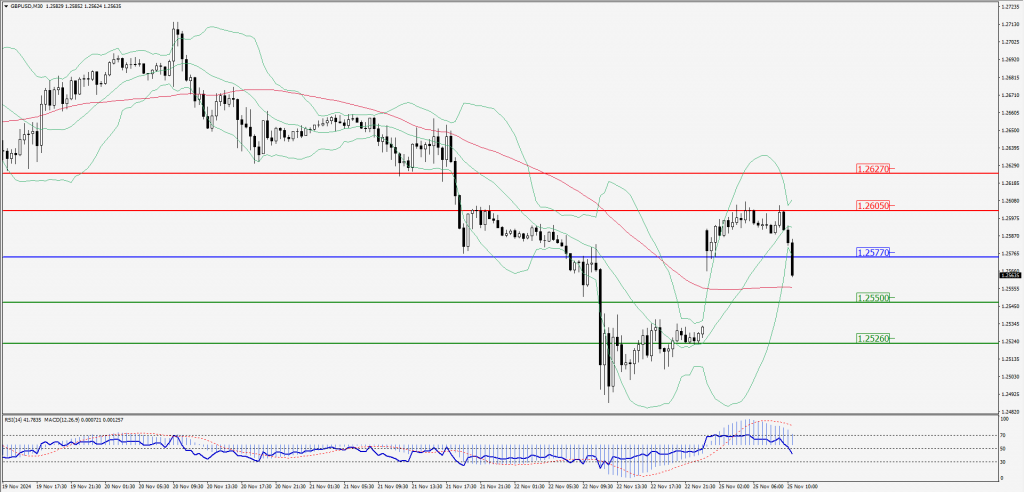
Green Lines Indicate Resistance Levels – Red Lines Indicate Support Levels
Light Blue is a Pivot Point – Black represents the price when the report was produced
USD/JPY Intraday: Trend on the upside
Our pivot point is at 154.450
Preferable Price Action: Buy position above pivot with the target at 154.800 and 155.100 in extension.
Alternative Price Action: The downside breakout of the pivot would call for 154.110 and 153.820.
Comment: MACD is above 50 levels and pairs above its 55MA & 20MA.
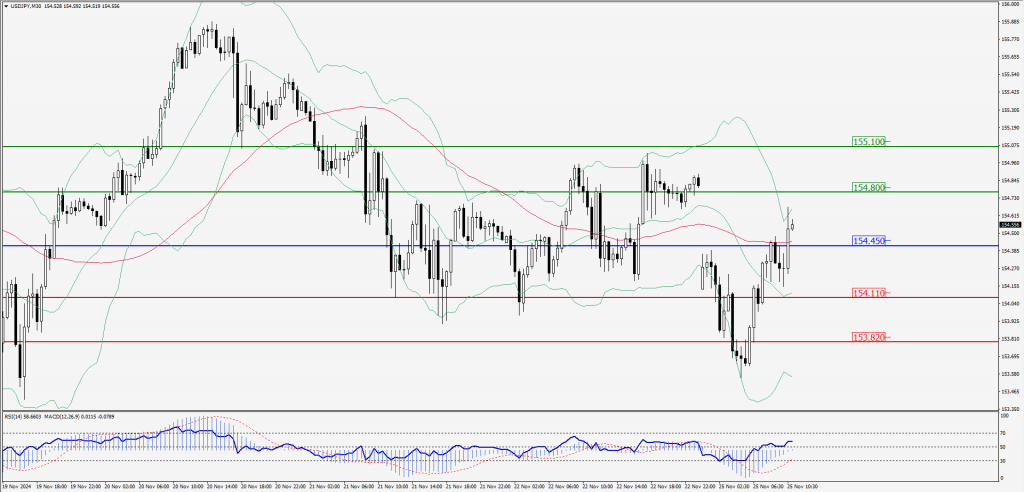
Green Lines Indicate Resistance Levels – Red Lines Indicate Support Levels
Light Blue is a Pivot Point – Black represents the price when the report was produced
AUD/USD Intraday: Trend on the downside
Our pivot point is at 0.65090
Preferable Price Action: Sell positions below pivot with targets at 0.64990 & 0.64900 in extension.
Alternative Price Action: Above pivot a further upside with 0.65190 & 0.65280 as targets.
Comment: RSI is below 50 levels and pairs below its 20MA.
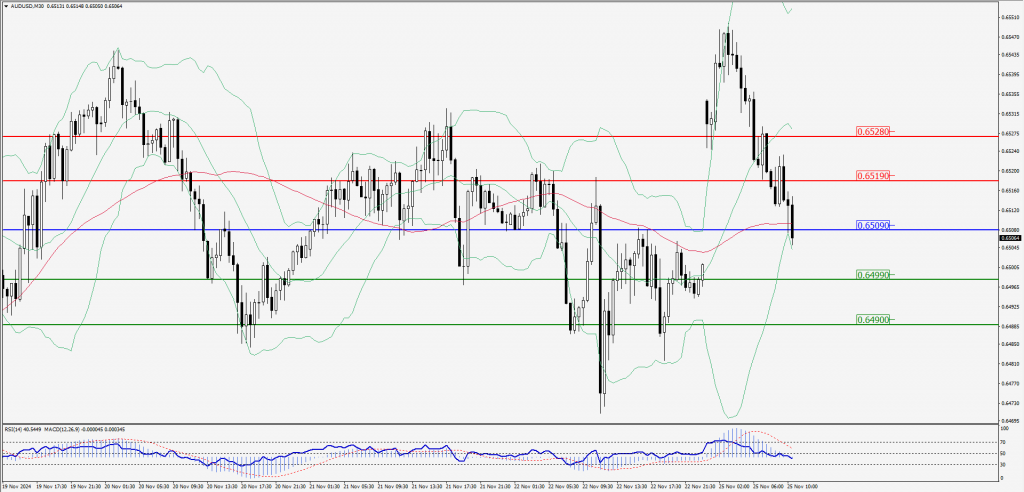
Green Lines Indicate Resistance Levels – Red Lines Indicate Support Levels
Light Blue is a Pivot Point – Black represents the price when the report was produced
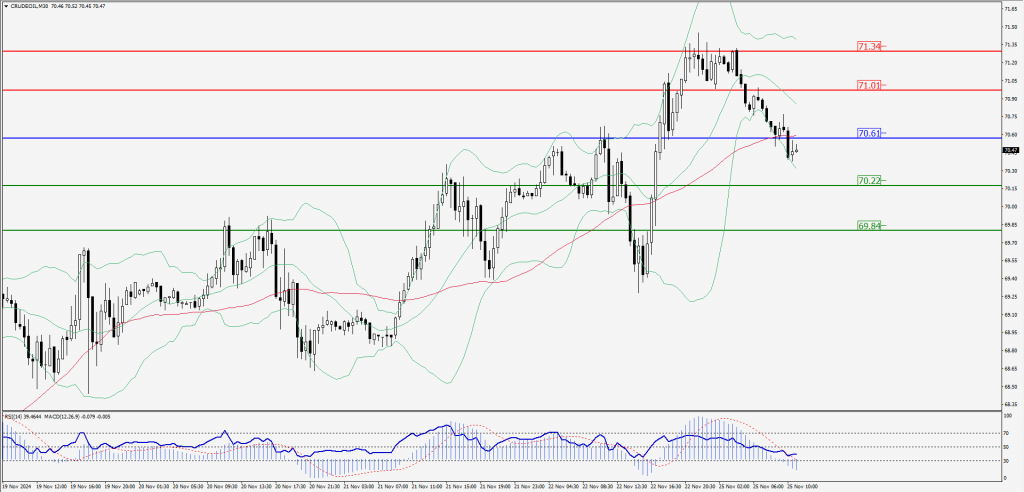
CRUDEOIL Intraday: Trend on the downside
Our pivot point is at 70.61
Preferable Price Action: Below pivot sell oil with 70.22 & 69.84 as targets.
Alternative Price Action: Buy crude above pivot with targets at 71.01 & 71.34 in extension.
Comment: RSI is at below 50 levels and pairs below its 55MA & 20MA.
Green Lines Indicate Resistance Levels – Red Lines Indicate Support Levels
Light Blue is a Pivot Point – Black represents the price when the report was produced
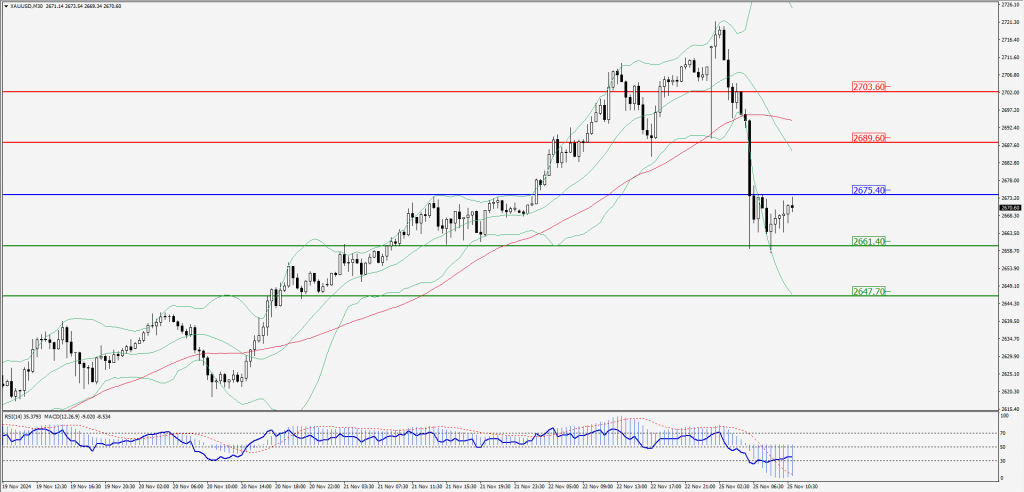
XAU/USD Intraday: Trend on the downside
Our pivot point is at 2675.40
Preferable Price Action: Further downside to 2661.40 and 2647.70.
Alternative Price Action: If the price gives an upside breakout of a pivot, then the price extends to 2689.60 and 2703.60.
Comment: MACD is below 50 levels and pairs below its 20MA & 55MA.
Green Lines Indicate Resistance Levels – Red Lines Indicate Support Levels
Light Blue is a Pivot Point – Black represents the price when the report was produced
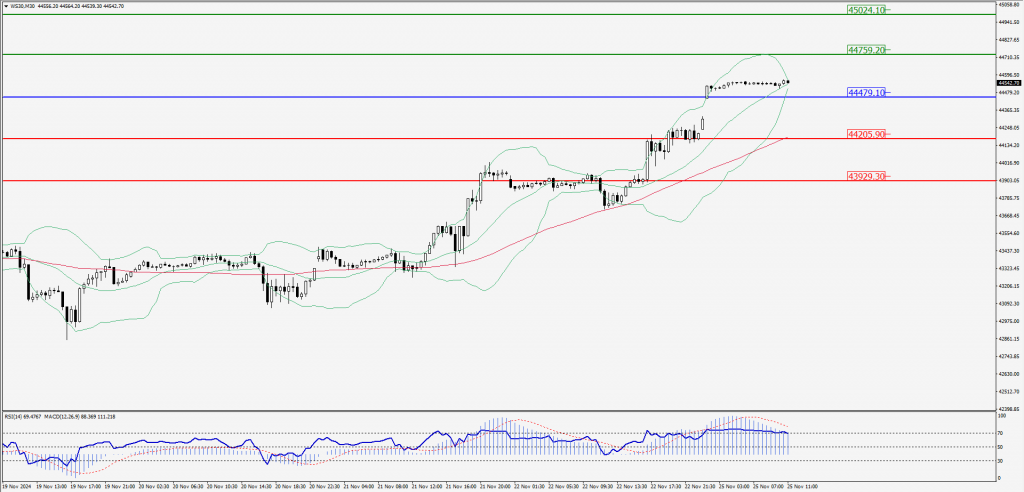
Dow Jones Intraday: Major trend on the upside
Our pivot point is 44,429.10
Preferable Price Action: Take buy positions above the pivot with targets at 44,759.20 & 45,024.10.
Alternative Price Action: Below 43,861.40 looks for further downside to 44,205.90 & 43,929.30.
Comment: RSI is above 50 levels and pairs above its 55MA.
Green Lines Indicate Resistance Levels – Red Lines Indicate Support Levels
Light Blue is a Pivot Point – Black represents the price when the report was produced