Market Wrap: Stocks, Bonds, Commodities
Most Asian currencies weakened on Friday as fears of more trade ructions between the U.S. and China dented sentiment, with the dollar benefiting from safe-haven demand even as bets on interest rate cuts persisted.
The Dow Jones Industrial Average fell 533.06 points to 40,665.02, the S&P 500 loss 0.78% to 5,544.59 and the Nasdaq Composite descend 125.71 points to 17,871.22.
MSCI’s index of Asia-Pacific stocks outside Japan is down 1.62% to 696.80 levels. The Australian index was lower by 0.81% to 7,971.22. Japanese Nikkei Index decrease 0.07% today.
European stocks were negative on Friday, with the Stoxx Europe 50 Index decrease 0.34% to 4,853.45, Germany’s DAX descend 0.60% to 18,252.45, and France’s CAC lower 0.60% to 7,560.87 and U.K.’s FTSE 100 loss 0.63% to 8,153.50.
Benchmark 10-year U.S. Treasury rose as demand for safe assets slipped again, today 10-year bond yields increase 0.50% to 4.2080.
Oil prices fell in Asian trade on Friday, and were headed for a weekly loss amid persistent concerns over slowing demand in top importer China, while sentiment was also dented by concerns over trade ructions with the U.S.
Spot Brent crude oil decrease 0.61% to $84.59 per barrel. US West Texas Intermediate crude is decrease 0.84% to $80.62 a barrel.
The yellow metal gold is down 1.45% to 2,420.80 dollars per ounce.
Market Wrap: Forex
The euro fell on Friday after the European Central Bank kept rates steady, as was widely expected, while the dollar index climbed after stronger-than-expected data on the U.S. labor market and manufacturing.
Today, the U.S. dollar index measures the Greenback against a trade-weighted basket of six major currencies, which increase 0.11% to 104.0000.
The Euro US Dollar (EUR/USD) is a widely traded pair that is descend 0.06% today. This left the pair trading around $1.08890.
The Japanese yen was will move positive against the U.S. dollar on Friday. Today USD/JPY is trades pair that increase 0.04% to the 157.430 level.
Another commodity-related currency negative against the U.S dollar, AUD/USD fell 0.13% to 0.66960, and NZD/USD decrease 0.24% to 0.60290 level.
EUR/USD Intraday: Trend on the downside
Our pivot point is at 1.08920
Preferable Price Action: Take sell positions below pivot level with targets at 1.08820 & 1.08740 in extension.
Alternative Price Action: Buy pivot looks for a further upside to 1.09020 & 1.09110.
Comment: RSI is below 50 levels and Pairs below its 20MA & 55MA.
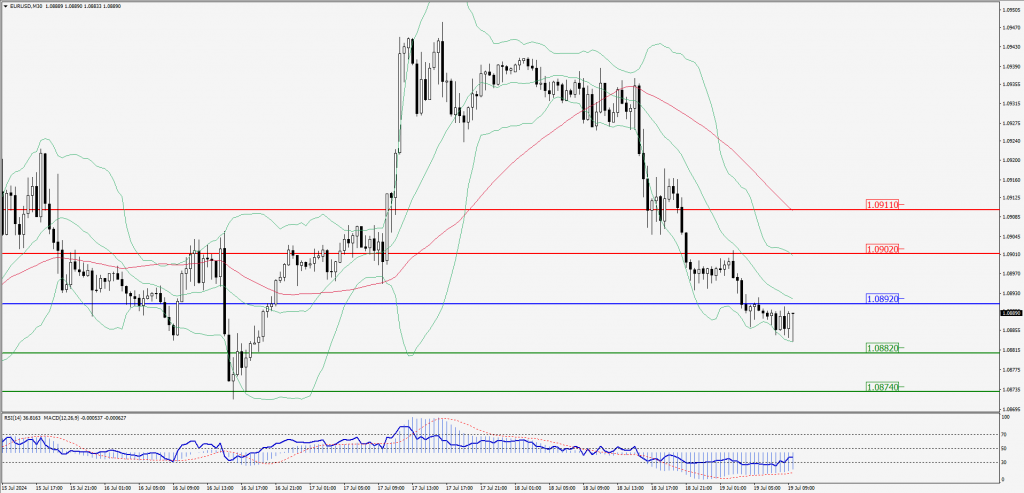
Green Lines Indicate Resistance Levels – Red Lines Indicate Support Levels
Light Blue is a Pivot Point – Black represents the price when the report was produced
GBP/USD Intraday: Trend on the downside
Our pivot point is at 1.29400
Preferable Price Action: Sell positions below pivot with targets at 1.29200 & 1.29010 in extension.
Alternative Price Action: The price above pivot would call for further upside to 1.29600 & 1.29810.
Comment: RSI is below 50 levels and Pairs below its 55MA & 20MA.
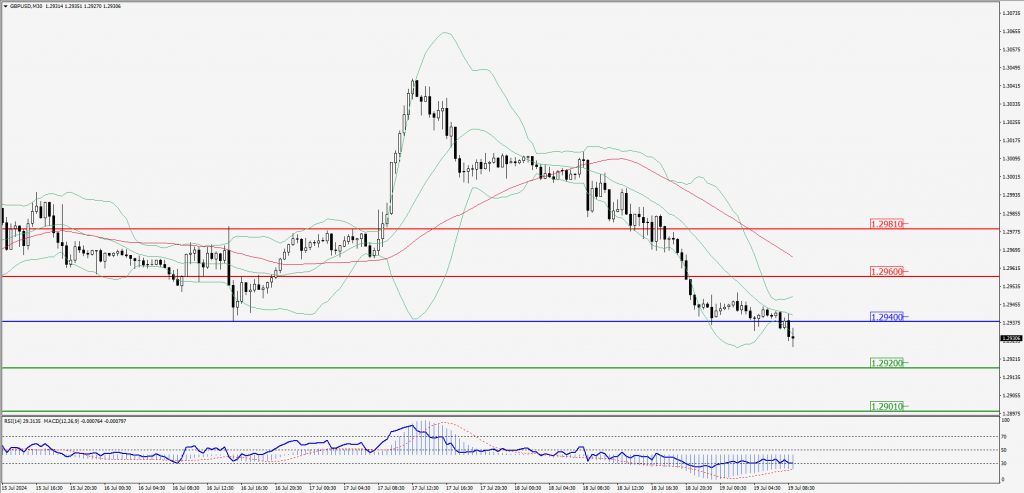
Green Lines Indicate Resistance Levels – Red Lines Indicate Support Levels
Light Blue is a Pivot Point – Black represents the price when the report was produced
USD/JPY Intraday: Trend on the upside
Our pivot point is at 157.540
Preferable Price Action: Buy position above pivot with the target at 157.980 and 158.370 in extension.
Alternative Price Action: The downside breakout of the pivot would call for 157.080 and 156.660.
Comment: MACD is above 50 levels Pairs above its 55MA & 20MA.
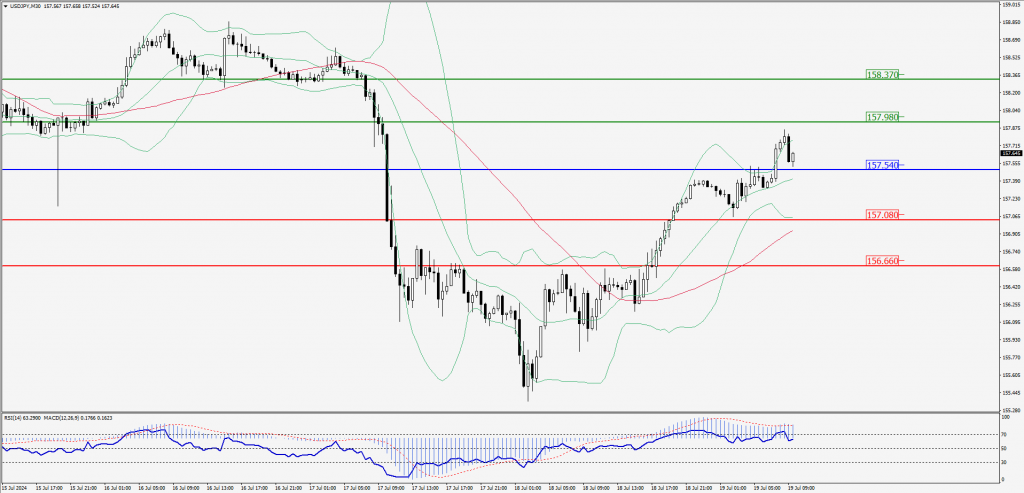
Green Lines Indicate Resistance Levels – Red Lines Indicate Support Levels
Light Blue is a Pivot Point – Black represents the price when the report was produced
AUD/USD Intraday: Trend on the downside
Our pivot point is at 0.67080
Preferable Price Action: Sell positions below pivot with targets at 0.66940 & 0.66840 in extension.
Alternative Price Action: Above pivot a further upside with 0.67210 & 0.67320 as targets.
Comment: RSI is below 50 levels and Pairs below its 55MA.
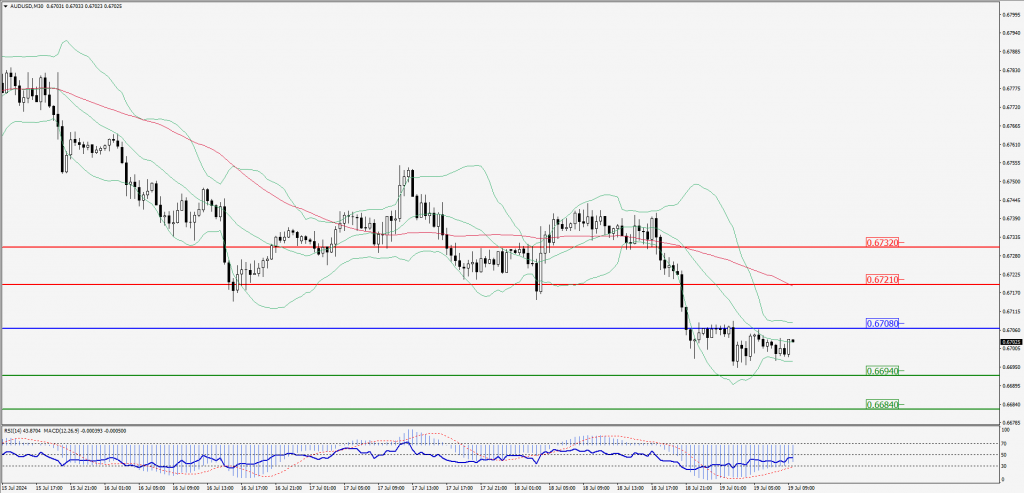
Green Lines Indicate Resistance Levels – Red Lines Indicate Support Levels
Light Blue is a Pivot Point – Black represents the price when the report was produced
CRUDEOIL Intraday: Trend on the downside
Our pivot point is at 80.73
Preferable Price Action: Below pivot sell oil with 80.38 & 80.02 as targets.
Alternative Price Action: Buy crude above pivot with targets at 81.09 and 81.44 in extension.
Comment: RSI is below 50 levels and pairs below its 55MA.
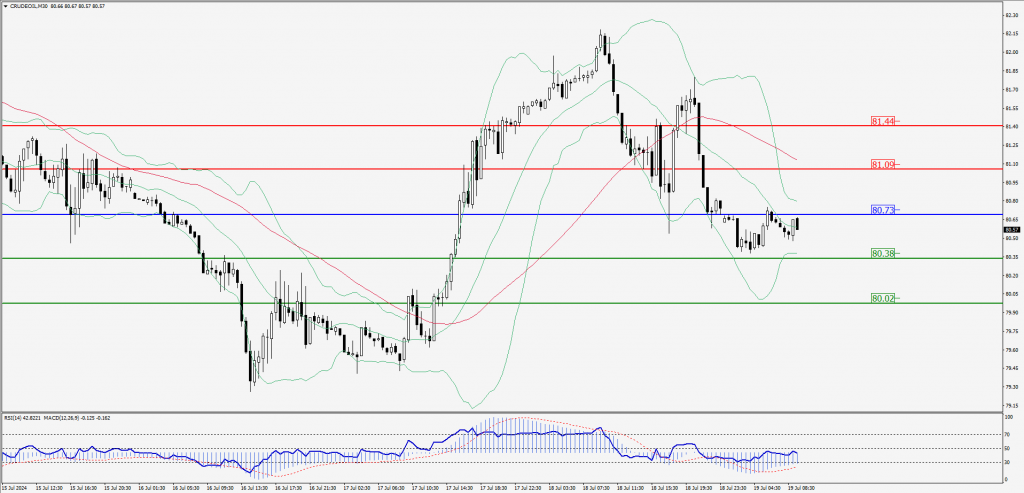
Green Lines Indicate Resistance Levels – Red Lines Indicate Support Levels
Light Blue is a Pivot Point – Black represents the price when the report was produced
XAU/USD Intraday: Major trend on the downside
Our pivot point is 2422.80
Preferable Price Action: Further downside to 2411.00 and 2402.10.
Alternative Price Action: If the price gives an upside breakout of a pivot, then the price extends to 2434.00 and 2443.50.
Comment: MACD is below 50 levels and Pairs below its 55MA & 20MA.
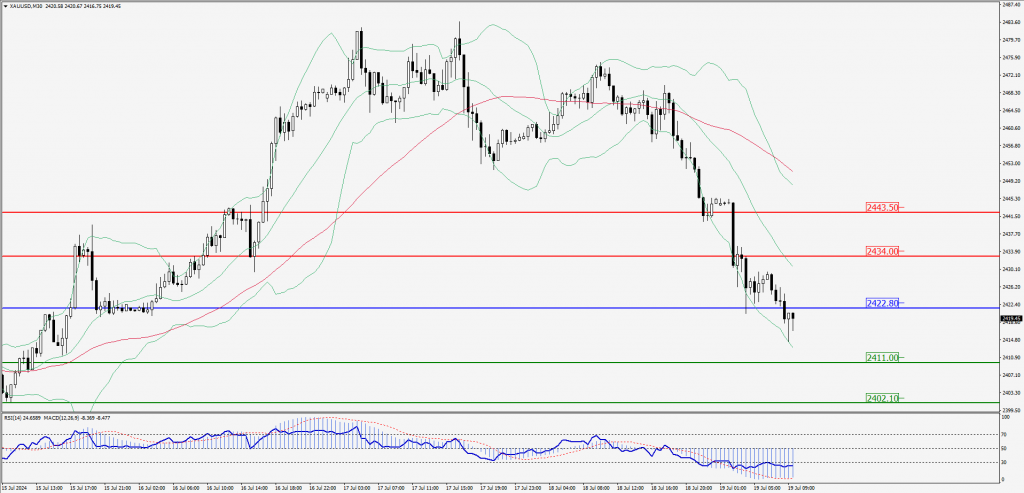
Green Lines Indicate Resistance Levels – Red Lines Indicate Support Levels
Light Blue is a Pivot Point – Black represents the price when the report was produced
Dow Jones Intraday: Trend on the downside
Our pivot point is 40,694.00
Preferable Price Action: Take sell positions below the pivot with targets at 40,500.80 & 40,348.10.
Alternative Price Action: Above 40,694.00 looks for further upside to 41,881.80 & 41,038.20.
Comment: RSI is below 50 levels and pairs below its 55MA & 20MA.
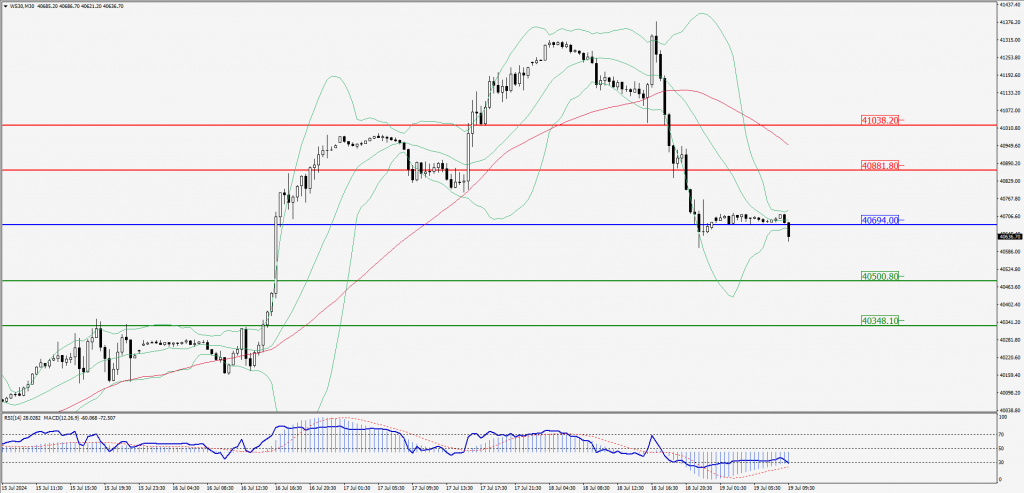
Green Lines Indicate Resistance Levels – Red Lines Indicate Support Levels
Light Blue is a Pivot Point – Black represents the price when the report was produced