Market Wrap: Stocks, Bonds, Commodities
American major stock indices gained on Tuesday boosts by the technology and healthcare stocks as traders start to bet on good quarterly earnings.
The Dow Jones Industrial Average advance 198.7 points (0.56%) to 35,457.31, the S&P 500 jumped 33.17 points (0.74%) to 4,519.63 and the Nasdaq Composite rose 107.28 points (0.71%) to 15,129.09.
MSCI’s index of Asia-Pacific stocks outside Japan is advancing 0.47% to 831.44 levels. Australian index rose 0.53% to 7,413.70. Japanese Nikkei Index advances 0.14% to 29,255.55.
European stocks were lower on Wednesday, with the Stoxx Europe 50 Index falling 0.49% to 4,146.45, Germany’s DAX lost 0.30% to 15,469.50, and France’s CAC slipped 0.45% to 6,639.97, and U.K.’s FTSE 100 down 0.10% to 7,210.70.
Benchmark 10-year U.S. Treasury rose as demand for safe assets grows again, today 10-year bond yields gained 1.18% to 1.653.
Crudeoil rates gained on Tuesday and at 7 years highs as an energy supply crunch continued across the globe.
Spot Brent crude oil lost 0.78% to $84.42 per barrel. US West Texas Intermediate crude dropped 0.78% to $81.80 a barrel.
The yellow metal traded 0.34% higher to 1776.45 dollars per ounce.
Market Wrap: Forex
Today, the U.S. dollar index measures the greenback against a trade-weighted basket of six major currencies, which gained 0.06% to 93.782.
The Euro US Dollar (EUR/USD) is a widely traded pair that is fell 0.05% today. This left the pairing trading around $1.16290.
The Japanese yen rose against the U.S. dollar on Wednesday as the stock pushes higher. Today US/JPY is down 0.10% to 114.380 level.
Another commodity-related currency higher against the U.S dollar, AUD/USD rose 0.17% to 0.74840, and NZD/USD up 0.22% to 0.71660 level.
EUR/USD Intraday: Support at 1.16189
Our pivot point is at 1.16189
Preferable Price Action: Take long positions above pivot level with targets at 1.16777 & 1.17092 in extension.
Alternative Price Action: Below pivot looks for a further downside to 1.15704 & 1.15429.
Comment: Pair below its 55MA & 20MA and RSI below 50 levels.
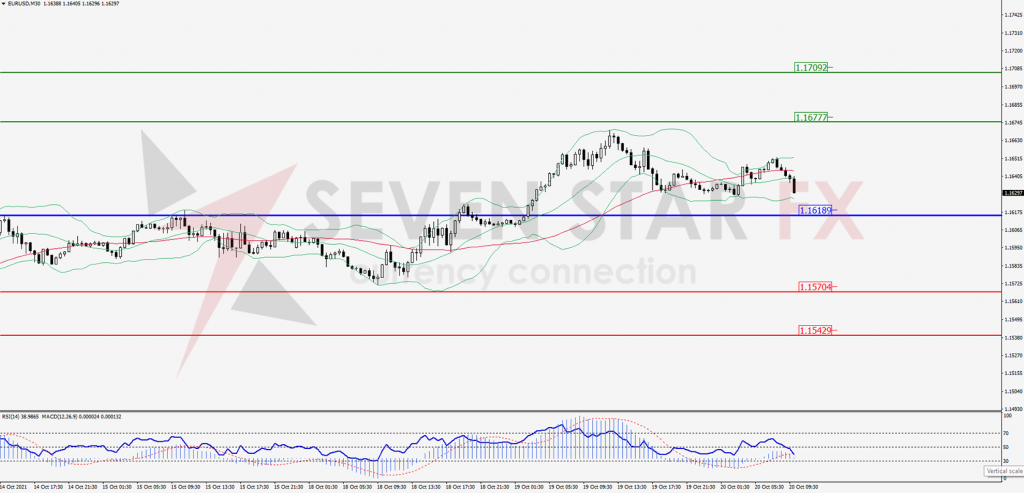
Green Lines Indicate Resistance Levels – Red Lines Indicates Support Levels
Light Blue is a Pivot Point – Black represents the price when the report was produced
GBP/USD Intraday: Trend on the upside
Our pivot point is at 1.37548
Preferable Price Action: Buy positions above pivot with targets at 1.38435 & 1.38798 in extension.
Alternative Price Action: The price below pivot would call for further downside to 1.36717 & 1.36308.
Comment: Pair below its 50MA & 20MA and RSI below 50 levels.
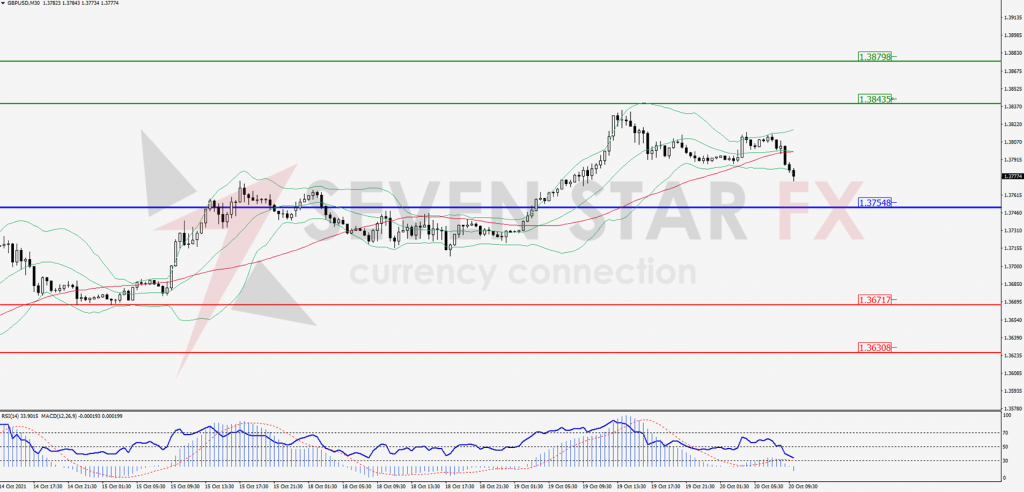
Green Lines Indicate Resistance Levels – Red Lines Indicates Support Levels
Light Blue is a Pivot Point – Black represents the price when the report was produced
USD/JPY Intraday: Support at 114.241
Our pivot point is at 114.241
Preferable Price Action: Buy position above pivot with the target at 113.902 and 113.235 in extension.
Alternative Price Action: The Downside breakout of the pivot would call for 115.577 and 115.301.
Comment: Price below its 55MA & 20MA and MACD in negative territory.
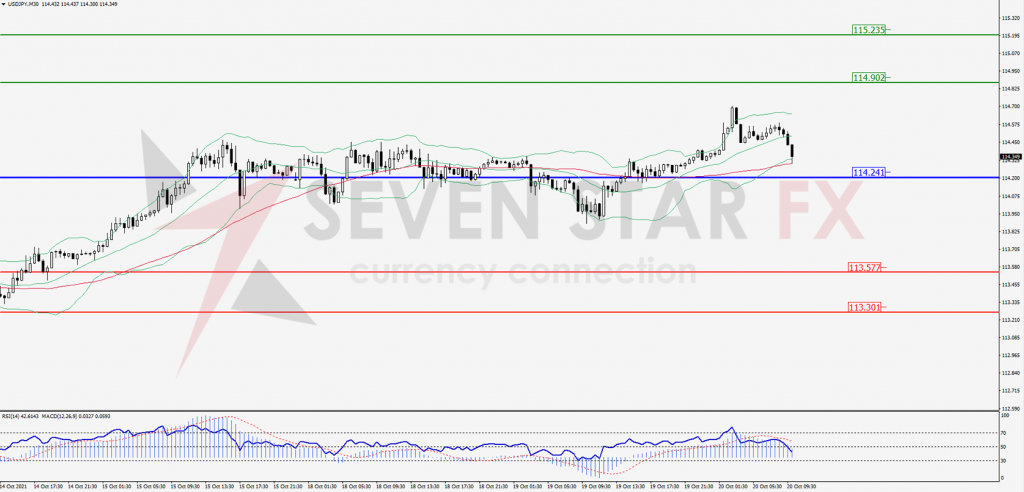
Green Lines Indicate Resistance Levels – Red Lines Indicates Support Levels
Light Blue is a Pivot Point – Black represents the price when the report was produced
AUD/USD Intraday: Trend on the upside
Our pivot point is at 0.74546
Preferable Price Action: Buy Positions above pivot with targets at 0.75129 & 0.75361 in extension.
Alternative Price Action: Below pivot looks for a further downside with 0.73984 & 0.73736 as targets.
Comment: Pair above its 55MA & 20MA and RSI above 50 levels.
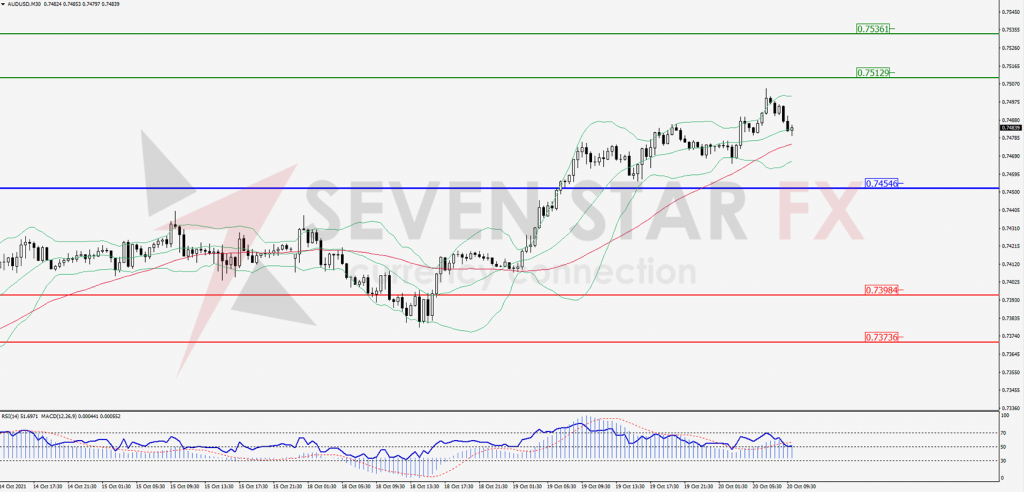
Green Lines Indicate Resistance Levels – Red Lines Indicates Support Levels
Light Blue is a Pivot Point – Black represents the price when the report was produced
CRUDEOIL Intraday: Resistance at 82.42
Our pivot point is at 82.42
Preferable Price Action: Below pivots sell Oil with 80.57 & 79.51 as targets.
Alternative Price Action: Buy crude Above pivot with targets at 84.50 and 85.31 in extension.
Comment: Crude is below its 55MA & 20MA and MACD in the negative territory.
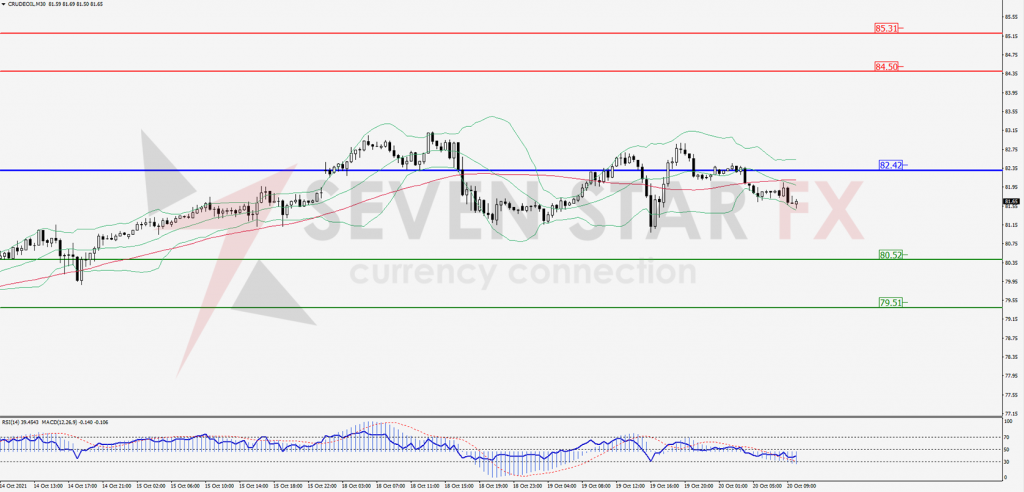
Green Lines Indicate Resistance Levels – Red Lines Indicates Support Levels
Light Blue is a Pivot Point – Black represents the price when the report was produced
XAU/USD Intraday: In a consolidation zone
Our pivot point is 1769.78
Preferable Price Action: Further upside to 1789.91 and 1800.03.
Alternative Price Action: If the price gives a downside breakout of a pivot, then the price extends to 1749.89 and 1739.89.
Comment: MACD in positive territory and price above its 20MA & 55MA.
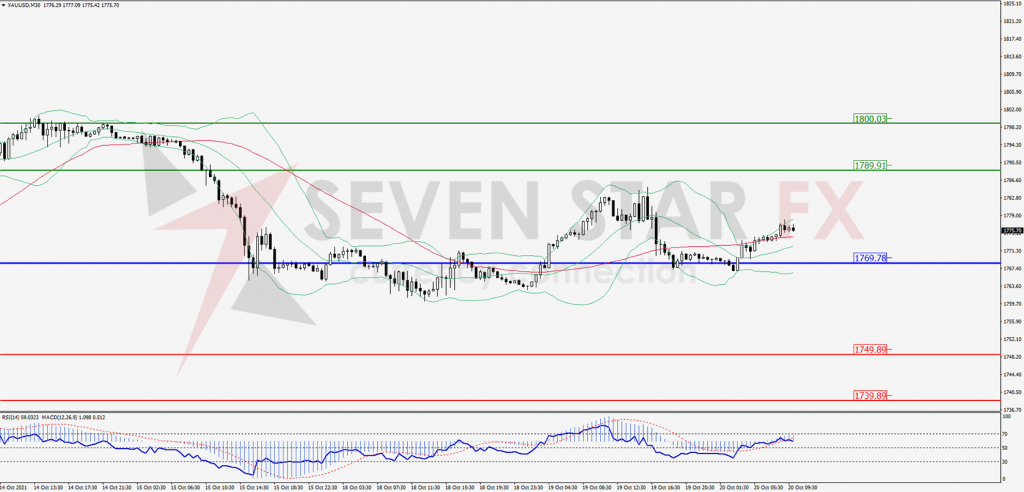
Green Lines Indicate Resistance Levels – Red Lines Indicates Support Levels
Light Blue is a Pivot Point – Black represents the price when the report was produced
Dow Jones Intraday: Trend on the upside
Our pivot point is 35,316.53
Preferable Price Action: Take long positions above pivot with targets at 35,675.95 & 35,906.81.
Alternative Price Action: Below 35,316.53 looks for further downside to 34,881.04 & 34,697.40.
Comment: Price above its 55MA & 20MA and RSI above 50 levels.
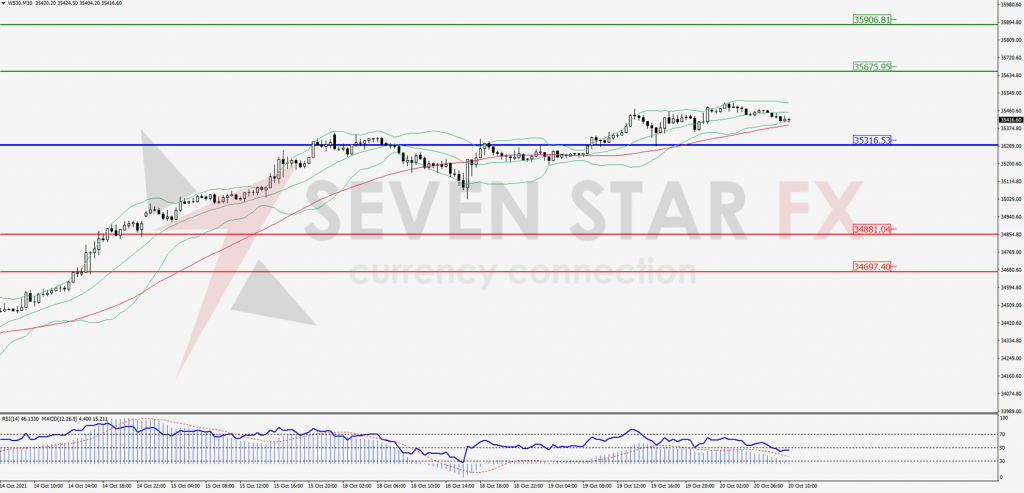
Green Lines Indicate Resistance Levels – Red Lines Indicates Support Levels
Light Blue is a Pivot Point – Black represents the price when the report was produced