Market Wrap: Stocks, Bonds, Commodities
Most Asian currencies moved in a tight range on Wednesday with the yuan treading water after China left benchmark rates unchanged, while the dollar steadied from recent losses.
The Dow Jones Industrial Average fail 120.66 points to 43,268.94, the S&P 500 gain 0.40% to 5,917.00 and the Nasdaq Composite up 195.66 points to 18,987.47.
MSCI’s index of Asia-Pacific stocks outside Japan is up 0.61% to 712.15 levels. The Australian index was lower by 0.57% to 8,326.30. Japanese Nikkei Index decrease 0.08% today.
European stocks were negative on Wednesday, with the Stoxx Europe 50 Index decrease 0.83% to 4,750.55 Germany’s DAX descend 0.67% to 19.060.31, and France’s CAC lower 0.67% to 7,229.64 and U.K.’s FTSE 100 loss 0.13% to 8,099.02.
Benchmark 10-year U.S. Treasury rose as demand for safe assets slipped again, today 10-year bond yields 0.82% to 4.4150.
Oil prices held steady for a second day on Wednesday as concerns about escalating hostilities in the Ukraine war potentially disrupting oil supply from Russia and signs of growing Chinese crude imports offset data showing U.S. crude stocks rising.
Spot Brent crude oil increase 0.15% to $73.42 per barrel. US West Texas Intermediate crude is increase 0.26% to $69.42 a barrel.
The yellow metal gold is up 0.05% to 2,632.40 dollars per ounce.
Market Wrap: Forex
The U.S. dollar slipped to a one-week low versus major peers on Wednesday, looking to extend a three-day decline from a one-week peak as the market catches its breath following the frantic rally in the wake of Donald Trump’s election.
Today, the U.S. dollar index measures the Greenback against a trade-weighted basket of six major currencies, which either ascend 0.07% to 106.222.
The Euro US Dollar (EUR/USD) is a widely traded is down 0.06% today. This left the pair trading around $1.05890.
The Japanese yen was will move positive against the U.S. dollar on Wednesday. Today USD/JPY is trades pair that increase 0.56% to the 155.52 level.
Another commodity-related currency negative against the U.S dollar, AUD/USD loss 0.02% to 0.65300, and NZD/USD decrease 0.17% to 0.59020 level.
EUR/USD Intraday: Resistance level at 1.05920
Our pivot point is at 1.05920
Preferable Price Action: Take sell positions below pivot level with targets at 1.05790 & 1.05670 in extension.
Alternative Price Action: Buy pivot looks for a further upside to 1.06050 & 1.06170.
Comment: RSI is below 50 levels and pairs below its 55MA.
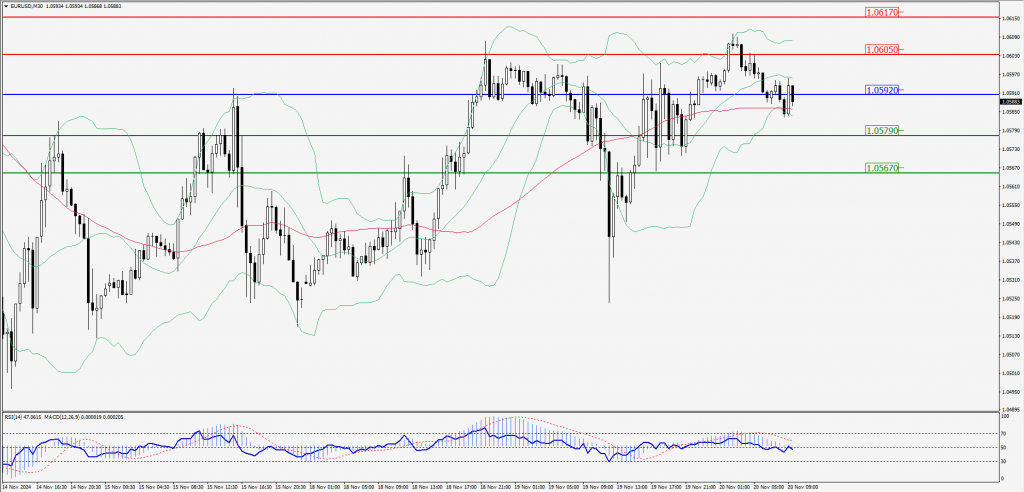
Green Lines Indicate Resistance Levels – Red Lines Indicate Support Levels
Light Blue is a Pivot Point – Black represents the price when the report was produced
GBP/USD Intraday: Trend on the upside
Our pivot point is at 1.26880
Preferable Price Action: Buy positions above pivot with targets at 1.27040 & 1.27180 in extension.
Alternative Price Action: The price below pivot would call for further downside to 1.26720 & 1.26580.
Comment: RSI is above 50 levels and pairs above its 55MA.
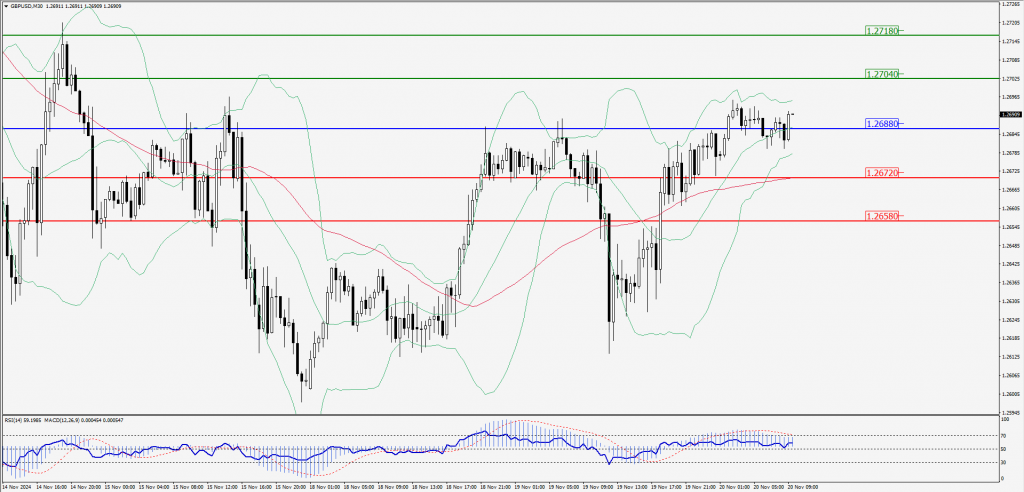
Green Lines Indicate Resistance Levels – Red Lines Indicate Support Levels
Light Blue is a Pivot Point – Black represents the price when the report was produced
USD/JPY Intraday: Major trend on the upside
Our pivot point is at 155.350
Preferable Price Action: Buy position above pivot with the target at 155.780 and 156.180 in extension.
Alternative Price Action: The downside breakout of the pivot would call for 154.910 and 154.510.
Comment: MACD is above 50 levels and pairs above its 55MA.
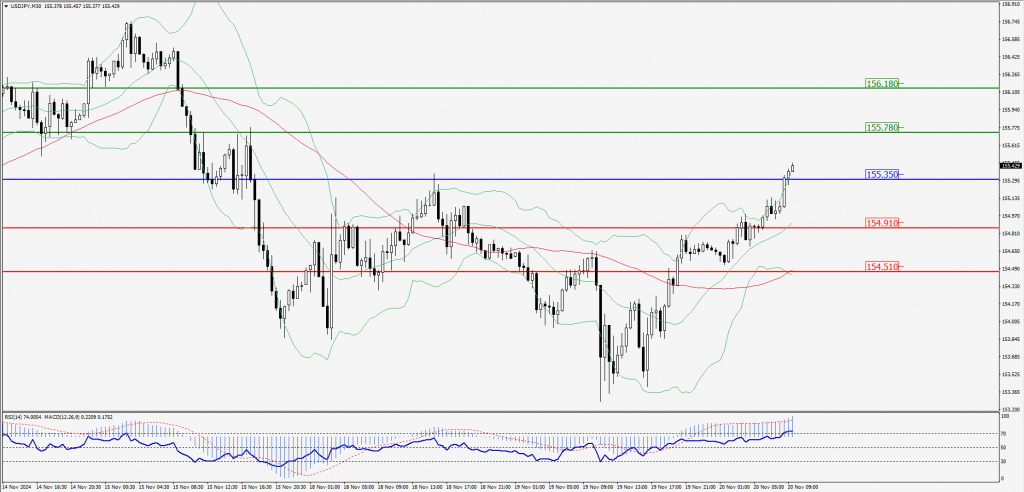
Green Lines Indicate Resistance Levels – Red Lines Indicate Support Levels
Light Blue is a Pivot Point – Black represents the price when the report was produced
AUD/USD Intraday: Trend on the upside
Our pivot point is at 0.65280
Preferable Price Action: Buy positions above pivot with targets at 0.65380 & 0.65470 in extension.
Alternative Price Action: Below pivot a further downside with 0.65180 & 0.65380 as targets.
Comment: RSI is above 50 levels and pairs above its 55MA.
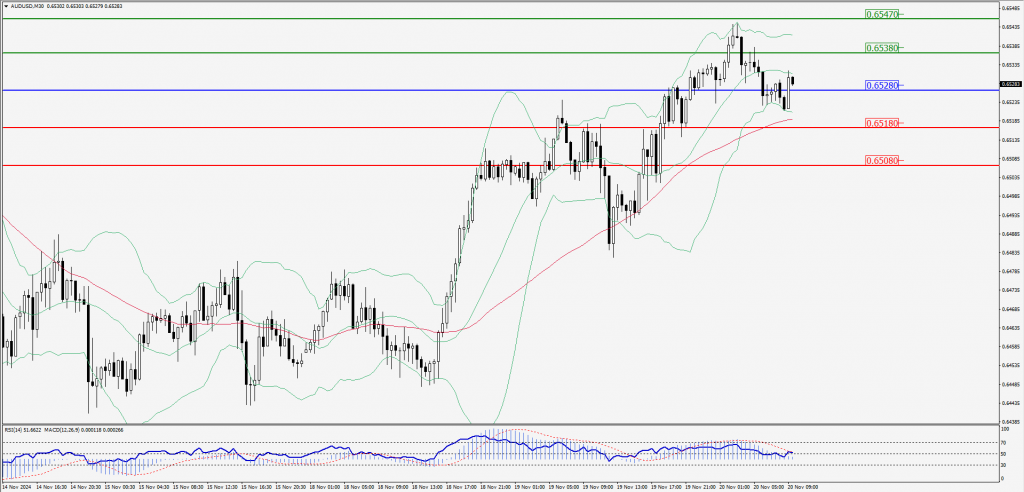
Green Lines Indicate Resistance Levels – Red Lines Indicate Support Levels
Light Blue is a Pivot Point – Black represents the price when the report was produced
CRUDEOIL Intraday: Trend on the upside
Our pivot point is at 69.13
Preferable Price Action: Above pivot buy oil with 69.51 & 69.88 as targets.
Alternative Price Action: Sell crude below pivot with targets at 68.75 & 68.41 in extension.
Comment: RSI is at above 50 levels and pairs above its 55MA.
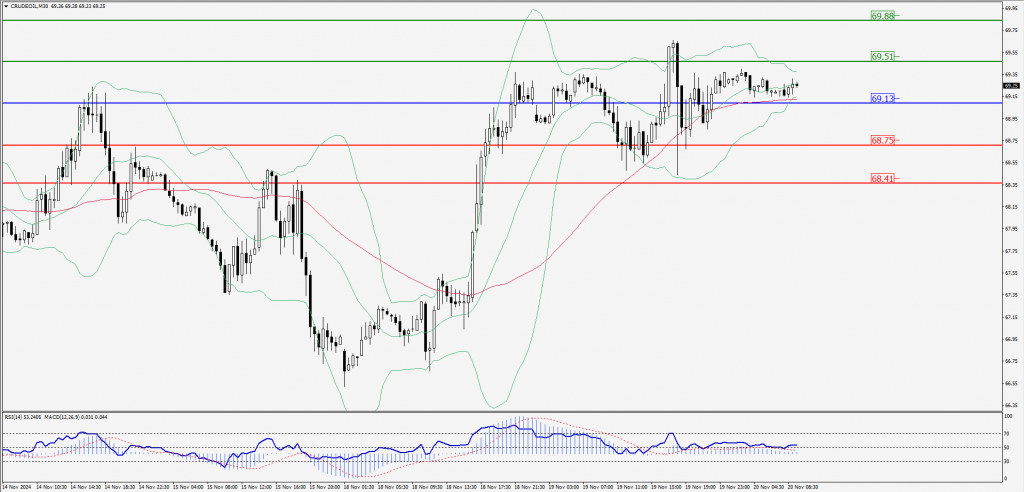
Green Lines Indicate Resistance Levels – Red Lines Indicate Support Levels
Light Blue is a Pivot Point – Black represents the price when the report was produced
XAU/USD Intraday: Trend on the downside
Our pivot point is at 2634.90
Preferable Price Action: Further downside to 2619.90 and 2606.10.
Alternative Price Action: If the price gives an upside breakout of a pivot, then the price extends to 2650.20 and 2663.20.
Comment: MACD is below 50 levels and pairs below its 20MA.
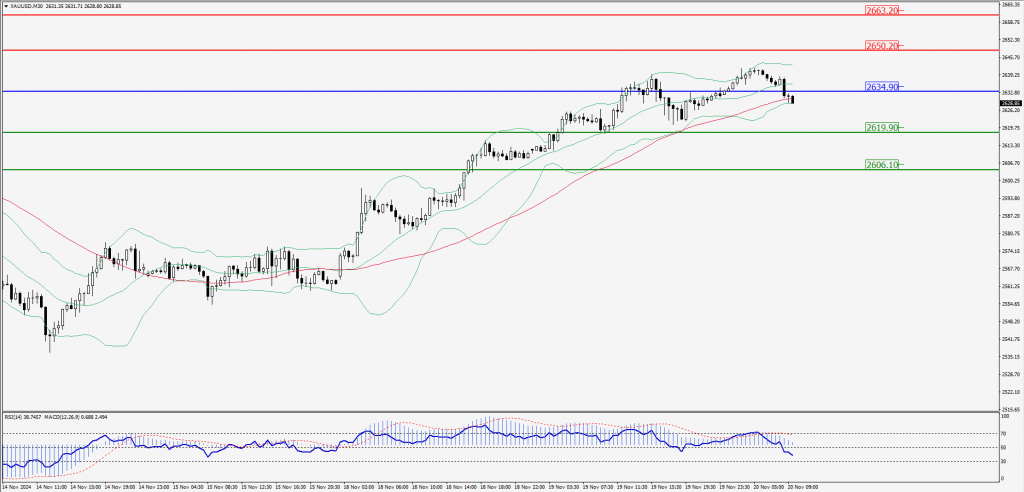
Green Lines Indicate Resistance Levels – Red Lines Indicate Support Levels
Light Blue is a Pivot Point – Black represents the price when the report was produced
Dow Jones Intraday: Trend on the upside
Our pivot point is 43,357.60
Preferable Price Action: Take buy positions above the pivot with targets at 43,499.00 & 43,638.70.
Alternative Price Action: Below 43,357.60 looks for further downside to 43,218.00 & 43,076.60.
Comment: RSI is above 50 levels and pairs above its 20MA & 55MA.
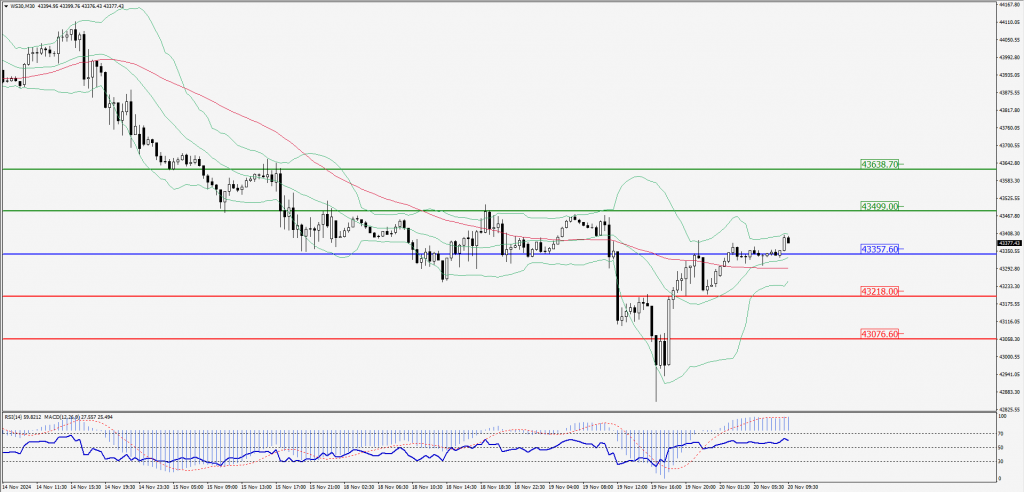
Green Lines Indicate Resistance Levels – Red Lines Indicate Support Levels
Light Blue is a Pivot Point – Black represents the price when the report was produced