Market Wrap: Stocks, Bonds, Commodities
US stock futures were near flat on Tuesday evening as investors took a breather from last week’s market rally.
The Dow Jones Industrial Average fell 245.25 points to 34,053.87, the S&P 500 lose 0.47% to 4,388.71 and the Nasdaq Composite subtract 22.28 points to 13,667.29.
MSCI’s index of Asia-Pacific stocks outside Japan is decline 1.16% to 639.73 levels. The Australian index was lower by 0.58% to 7,314.90. Japanese Nikkei Index advance 0.56% today.
European stocks were negative on Wednesday, with the Stoxx Europe 50 Index fell 0.17% to 4,335.05, Germany’s DAX decline 0.16% to 16,086.00, and France’s CAC drop 0.34% to 7,271.82 and U.K.’s FTSE 100 subtract 0.54% to 7,532.32.
Benchmark 10-year U.S. Treasury fell as demand for safe assets ascend again, today 10-year bond yields positive 0.62% to 3.7520.
Oil futures eased in choppy trading on Tuesday on forecasts for slower oil demand growth in China, the world’s second-biggest oil consumer, and disappointment with the size of cuts in China’s key lending rates.
Spot Brent crude oil ascend 0.41% to $76.22 per barrel. US West Texas Intermediate crude is up 0.51% to $71.55 a barrel.
The yellow metal gold is decline 0.07% to 1,946.25 dollars per ounce.
Market Wrap: Forex
The dollar was firmer on Wednesday leading into Federal Reserve Chair Jerome Powell’s appearance before Congress where he is expected to strike a hawkish tone, while sterling firmed slightly after hotter-than-expected British inflation data.
Today, the U.S. dollar index measures the Greenback against a trade-weighted basket of six major currencies, which surged 0.12% to 102.240.
The Euro US Dollar (EUR/USD) is a widely traded pair that is down 0.05% today. This left the pair trading around $1.09120.
The Japanese yen was negative against the U.S. dollar on Wednesday. Today USD/JPY is surged 0.37% to the 141.970 level.
Another commodity-related currency negative against the U.S dollar, AUD/USD fell 0.31% to 0.67640, and NZD/USD slipped 0.01% to 0.61640 level.
EUR/USD Intraday: Resistance level at 1.09210
Our pivot point is at 1.09210
Preferable Price Action: Take sell positions below pivot level with targets at 1.08910 & 1.08720 in extension.
Alternative Price Action: Above pivot looks for a further upside to 1.09480 & 1.09680.
Comment: RSI is below 50 levels and Pairs below 55MA.
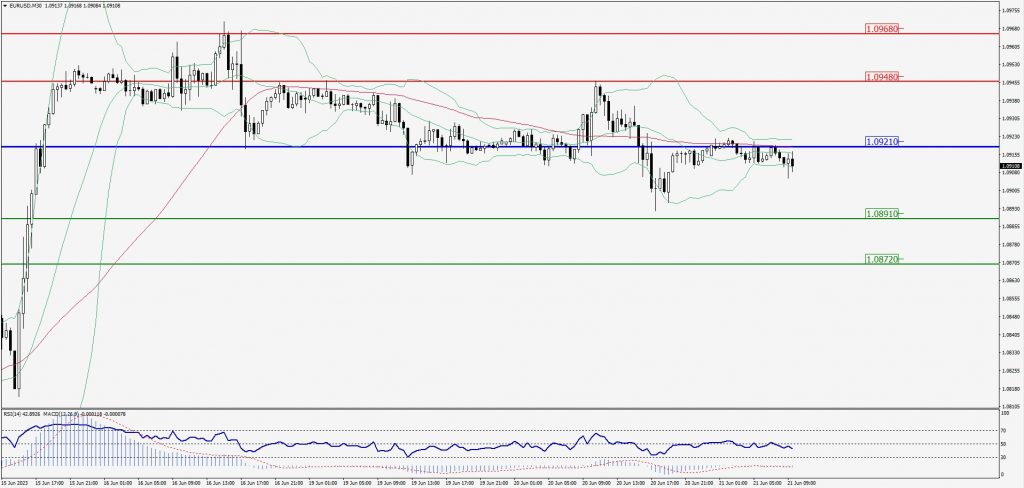
Green Lines Indicate Resistance Levels – Red Lines Indicate Support Levels
Light Blue is a Pivot Point – Black represents the price when the report was produced
GBP/USD Intraday: Trend on the upside
Our pivot point is at 1.27590
Preferable Price Action: Buy positions above pivot with targets at 1.28050 & 1.28370 in extension.
Alternative Price Action: The price below pivot would call for further downside to 1.27190 & 1.26920.
Comment: RSI is above 50 levels and Pairs above its 20MA & 55MA.
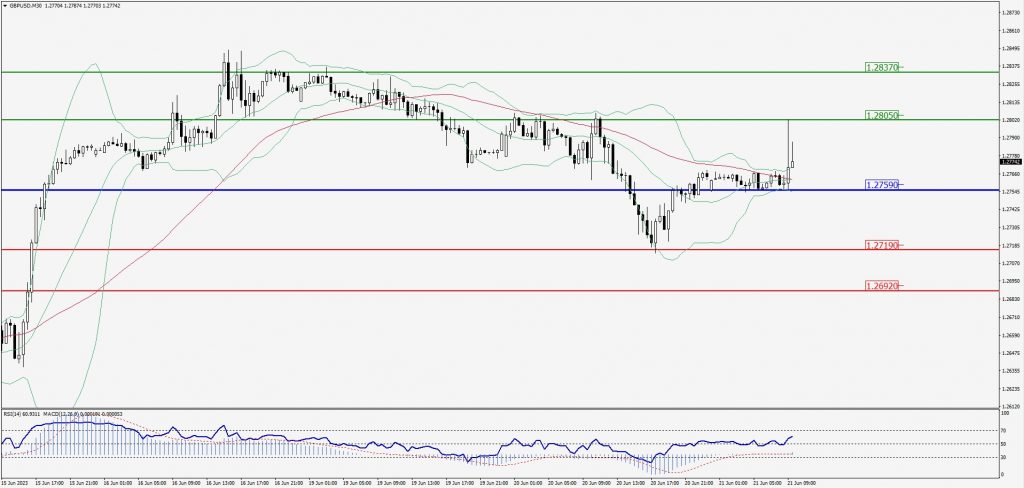
Green Lines Indicate Resistance Levels – Red Lines Indicate Support Levels
Light Blue is a Pivot Point – Black represents the price when the report was produced
USD/JPY Intraday: Major trend on the upside
Our pivot point is at 141.860
Preferable Price Action: Buy position above pivot with the target at 142.570 and 143.120 in extension.
Alternative Price Action: The downside breakout of the pivot would call for 141.180 and 140.650.
Comment: MACD is above 50 level and Pairs above its 20MA & 55MA.
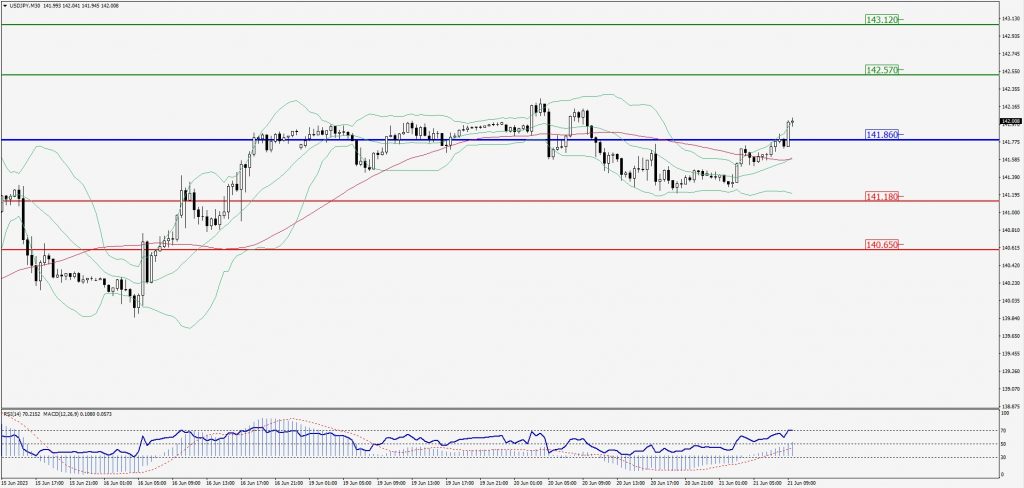
Green Lines Indicate Resistance Levels – Red Lines Indicate Support Levels
Light Blue is a Pivot Point – Black represents the price when the report was produced
AUD/USD Intraday: Trend on the downside
Our pivot point is at 0.67830
Preferable Price Action: Sell positions below pivot with targets at 0.67470 & 0.67260 in extension.
Alternative Price Action: Above pivot looks for a further upside with 0.68130 & 0.68380 as targets.
Comment: RSI is below 50 levels and Pairs below its 20MA & 55MA.
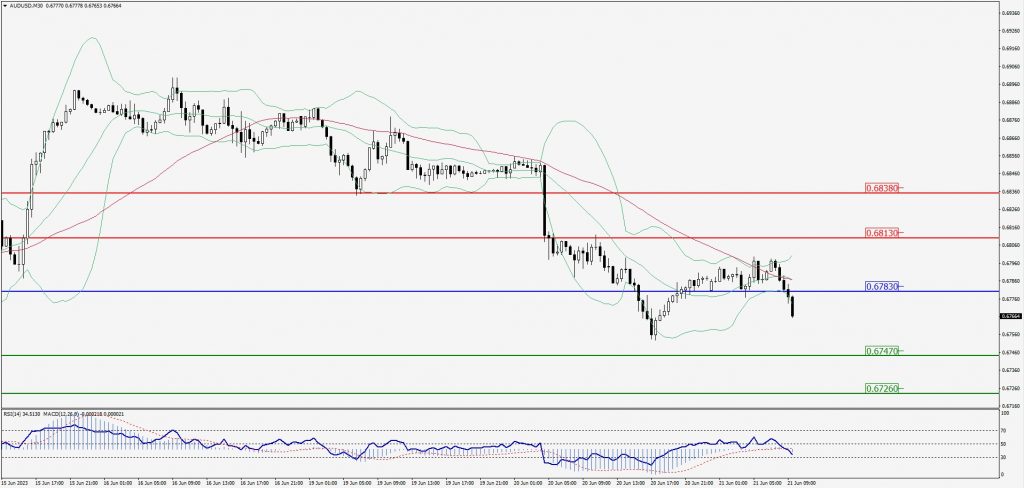
Green Lines Indicate Resistance Levels – Red Lines Indicate Support Levels
Light Blue is a Pivot Point – Black represents the price when the report was produced
CRUDEOIL Intraday: Support level at 71.06
Our pivot point is at 71.06
Preferable Price Action: Above pivot buy oil with 72.09 & 72.85 as targets.
Alternative Price Action: Sell crude below pivot with targets at 70.05 and 69.37 in extension.
Comment: MACD is positive territory and Pairs above its 20MA & 55MA.
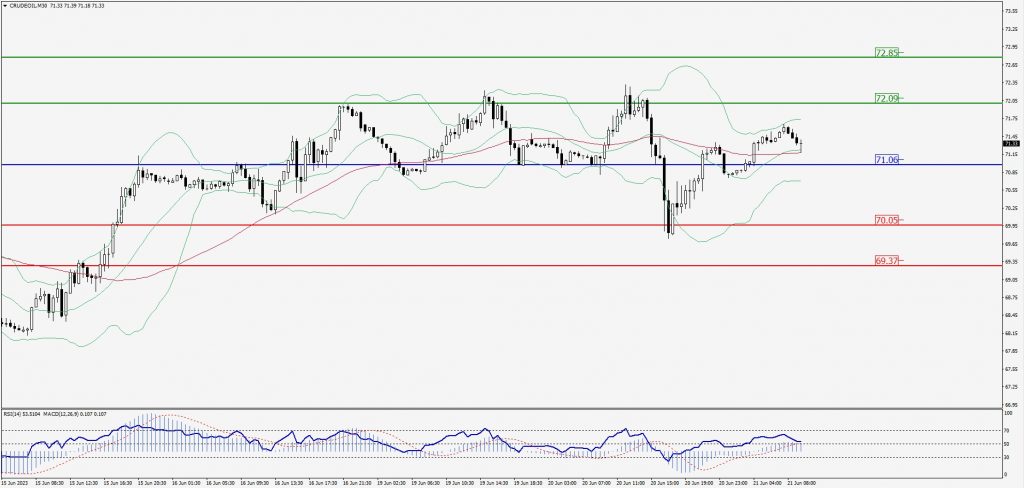
Green Lines Indicate Resistance Levels – Red Lines Indicate Support Levels
Light Blue is a Pivot Point – Black represents the price when the report was produced
XAU/USD Intraday: Trend on the downside
Our pivot point is 1937.30
Preferable Price Action: Further downside to 1930.10 and 1925.20
Alternative Price Action: If the price gives an upside breakout of a pivot, then the price extends to 1943.40 and 1948.30.
Comment: MACD is below 50 level and Pairs below its 20MA & 55MA.
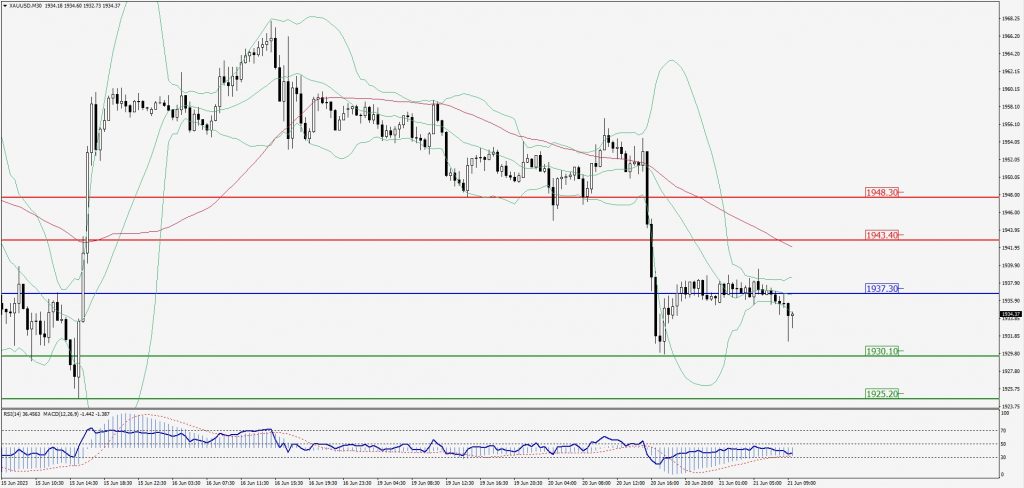
Green Lines Indicate Resistance Levels – Red Lines Indicate Support Levels
Light Blue is a Pivot Point – Black represents the price when the report was produced
Dow Jones Intraday: Trend on the downside
Our pivot point is 34,086.00
Preferable Price Action: Take sell positions below the pivot with targets at 33,943.00 & 33,851.00.
Alternative Price Action: Above 34,086.00 looks for further upside to 34,205.00 & 34,295.00.
Comment: RSI is below 50 levels and Pairs below its 20MA & 55MA.
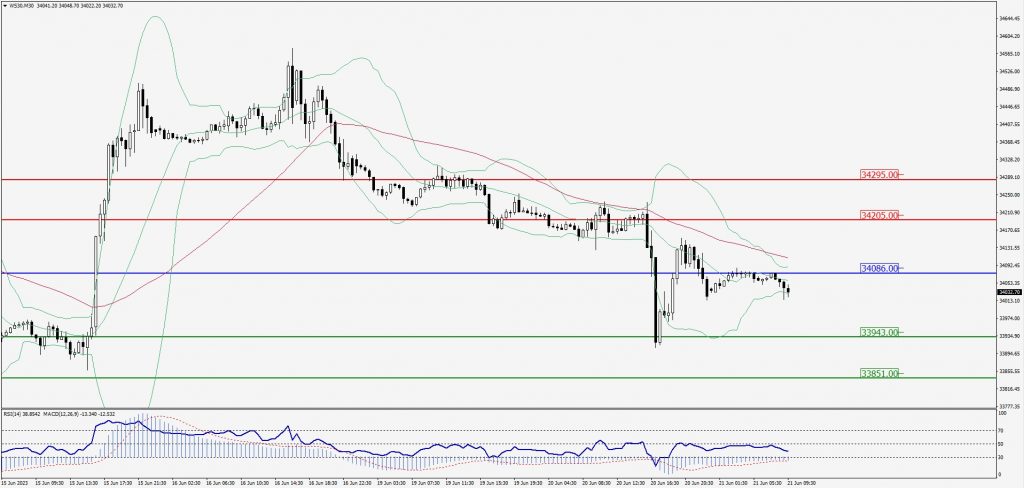
Green Lines Indicate Resistance Levels – Red Lines Indicate Support Levels
Light Blue is a Pivot Point – Black represents the price when the report was produced