Market Wrap: Stocks, Bonds, Commodities
Stock futures ticked lower on Monday evening as investors looked ahead to a holiday-shortened week of trading.
The Dow Jones Industrial Average fell 108.94 points to 34,299.12, the S&P 500 lose 0.37% to 4,409.59 and the Nasdaq Composite subtract 93.25 points to 13,689.57.
MSCI’s index of Asia-Pacific stocks outside Japan is decline 0.96% to 647.07 levels. The Australian index was higher by 0.86% to 7,357.80. Japanese Nikkei Index advance 0.06% today.
European stocks were mixed on Tuesday, with the Stoxx Europe 50 Index fell 0.49% to 4,340.95, Germany’s DAX decline 0.72% to 16,085.75, and France’s CAC drop 0.37% to 7,287.14 and U.K.’s FTSE 100 add 0.10% to 7,592.14.
Benchmark 10-year U.S. Treasury fell as demand for safe assets ascend again, today 10-year bond yields positive 0.70% to 3.7980.
Global oil prices fell more than $1 on Monday, backing off last week’s gains, as questions over China’s economy outweighed OPEC+ output cuts and the seventh straight drop in the number of oil and gas rigs operating in the United States.
Spot Brent crude oil ascend 1.31% to $77.12 per barrel. US West Texas Intermediate crude is up 0.56% to $72.33 a barrel.
The yellow metal gold is decline 0.36% to 1,964.15 dollars per ounce.
Market Wrap: Forex
The U.S. dollar gained in early European trade Tuesday, with this safe haven in demand as a rate cut by China’s central bank failed to assuage investor concerns over slowing economic growth.
Today, the U.S. dollar index measures the Greenback against a trade-weighted basket of six major currencies, which surged 0.20% to 102.040.
The Euro US Dollar (EUR/USD) is a widely traded pair that is up 0.08% today. This left the pair trading around $1.09300.
The Japanese yen was negative against the U.S. dollar on Tuesday. Today USD/JPY is slipped 0.27% to the 141.610 level.
Another commodity-related currency negative against the U.S dollar, AUD/USD fell 0.80% to 0.67950, and NZD/USD slipped 0.31% to 0.61810 level.
EUR/USD Intraday: Support level at 1.09150
Our pivot point is at 1.09150
Preferable Price Action: Take buy positions above pivot level with targets at 1.09480 & 1.09720 in extension.
Alternative Price Action: Below pivot looks for a further downside to 1.08890 & 1.08660.
Comment: RSI is at 50 levels and Pairs above 20MA.
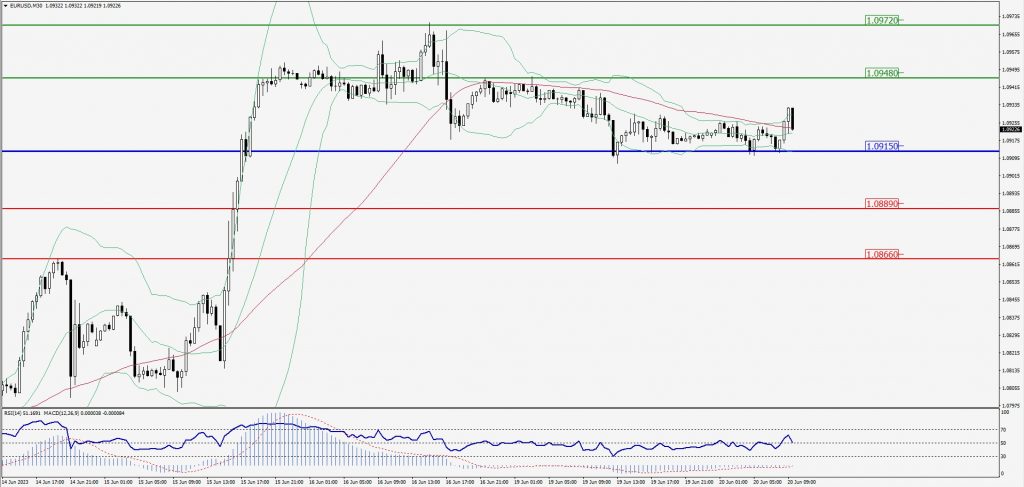
Green Lines Indicate Resistance Levels – Red Lines Indicate Support Levels
Light Blue is a Pivot Point – Black represents the price when the report was produced
GBP/USD Intraday: Trend on the downside
Our pivot point is at 1.27960
Preferable Price Action: Sell positions below pivot with targets at 1.27400 & 1.27100 in extension.
Alternative Price Action: The price above pivot would call for further upside to 1.28380 & 1.28730.
Comment: RSI is below 50 levels and Pairs below its 20MA & 55MA.
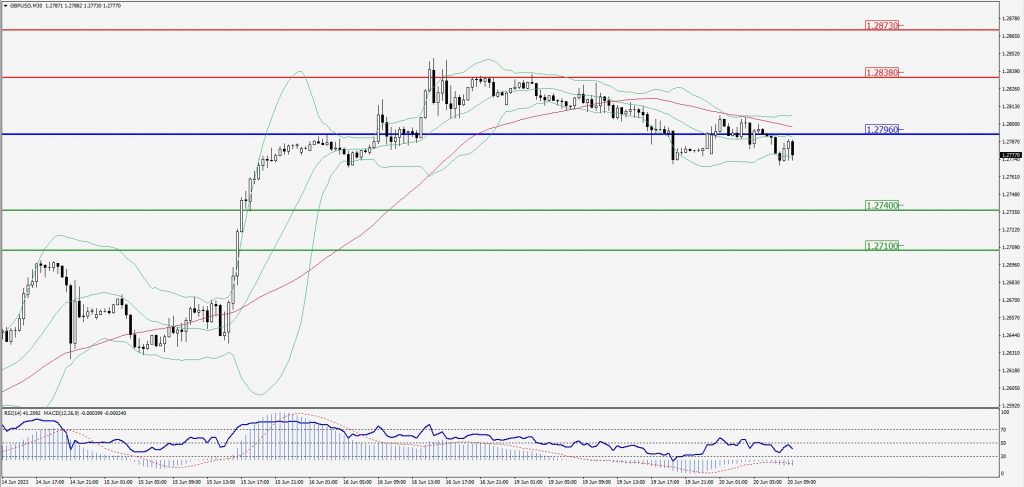
Green Lines Indicate Resistance Levels – Red Lines Indicate Support Levels
Light Blue is a Pivot Point – Black represents the price when the report was produced
USD/JPY Intraday: In a consolidation zone
Our pivot point is at 141.760
Preferable Price Action: Buy position above pivot with the target at 142.480 and 142.930 in extension.
Alternative Price Action: The downside breakout of the pivot would call for 141.070 and 140.660.
Comment: MACD is at 50 level and Pairs above 55MA.
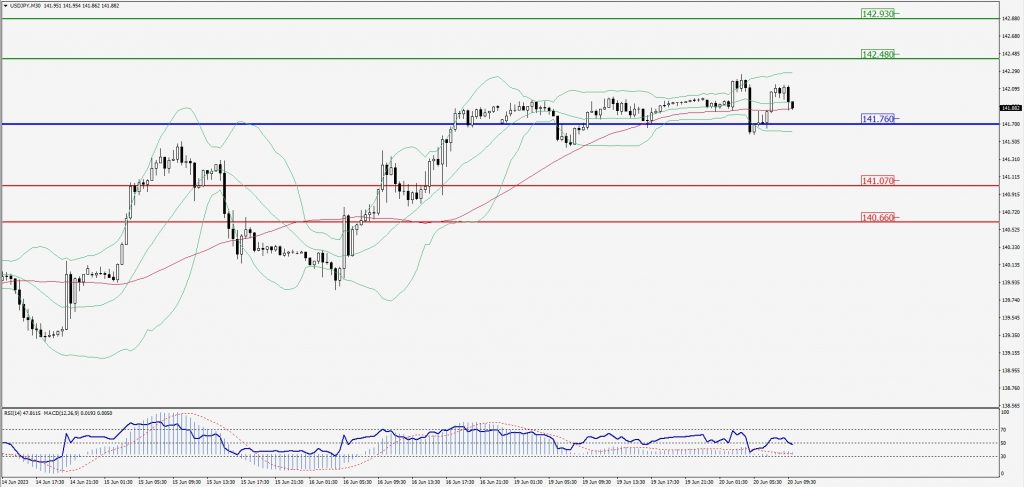
Green Lines Indicate Resistance Levels – Red Lines Indicate Support Levels
Light Blue is a Pivot Point – Black represents the price when the report was produced
AUD/USD Intraday: Major trend on the downside
Our pivot point is at 0.68100
Preferable Price Action: Sell positions below pivot with targets at 0.67800 & 0.67600 in extension.
Alternative Price Action: Above pivot looks for a further upside with 0.68340 & 0.68530 as targets.
Comment: RSI is below 50 levels and Pairs below its 20MA & 55MA.
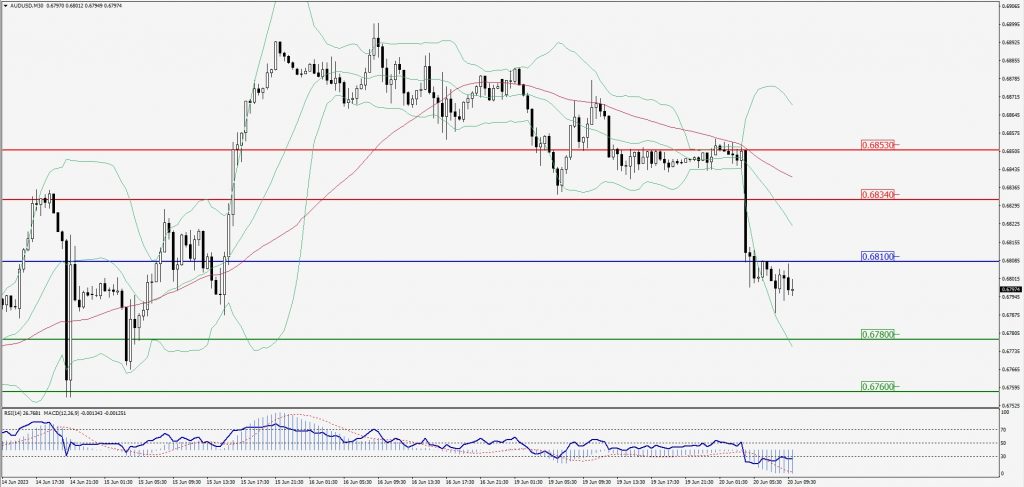
Green Lines Indicate Resistance Levels – Red Lines Indicate Support Levels
Light Blue is a Pivot Point – Black represents the price when the report was produced
CRUDEOIL Intraday: Support level at 70.93
Our pivot point is at 70.93
Preferable Price Action: Above pivot buy oil with 72.01 & 72.84 as targets.
Alternative Price Action: Sell crude below pivot with targets at 69.99 and 69.34 in extension.
Comment: MACD is positive territory and Pairs above 20MA.
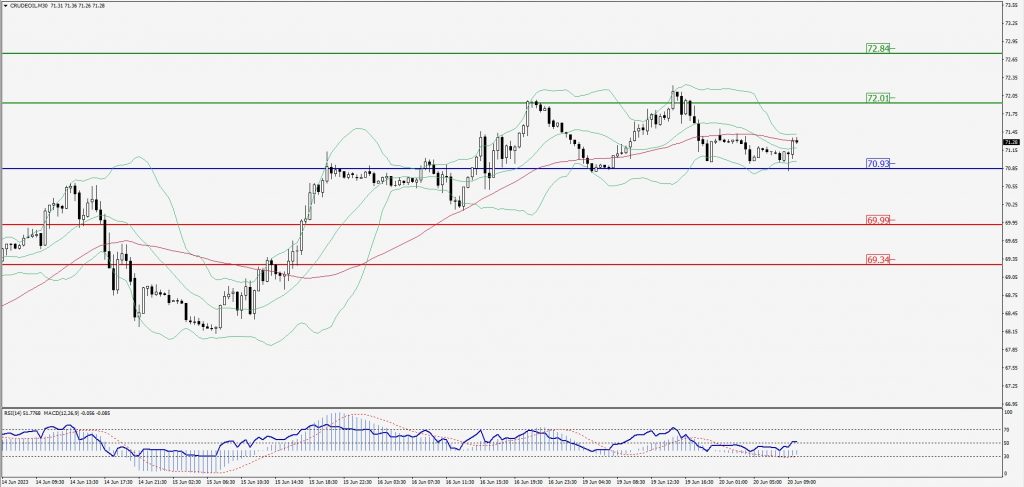
Green Lines Indicate Resistance Levels – Red Lines Indicate Support Levels
Light Blue is a Pivot Point – Black represents the price when the report was produced
XAU/USD Intraday: Trend on the upside
Our pivot point is 1949.10
Preferable Price Action: Further upside to 1957.40 and 1963.30
Alternative Price Action: If the price gives a downside breakout of a pivot, then the price extends to 1941.70 and 1936.20.
Comment: MACD is above 50 level and Pairs above 20MA.
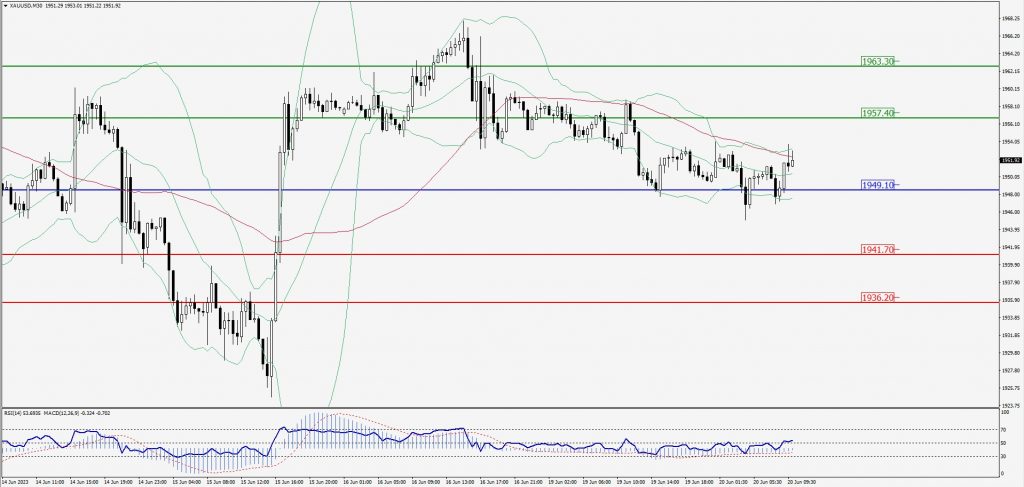
Green Lines Indicate Resistance Levels – Red Lines Indicate Support Levels
Light Blue is a Pivot Point – Black represents the price when the report was produced
Dow Jones Intraday: Trend on the downside
Our pivot point is 34,221.00
Preferable Price Action: Take sell positions below the pivot with targets at 34,087.00 & 34,002.00.
Alternative Price Action: Above 34,221.00 looks for further upside to 34,339.00 & 34,423.00.
Comment: RSI is below 50 levels and Pairs below its 20MA & 55MA.
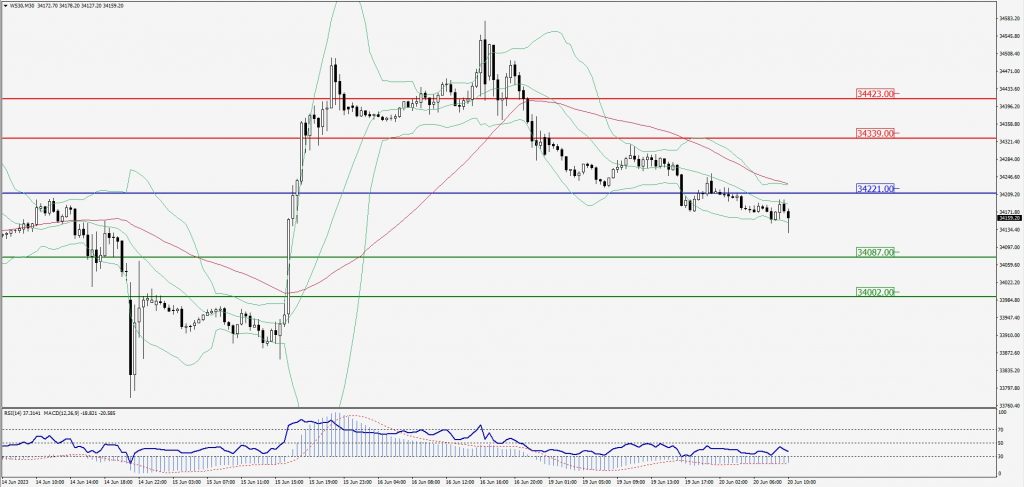
Green Lines Indicate Resistance Levels – Red Lines Indicate Support Levels
Light Blue is a Pivot Point – Black represents the price when the report was produced