Market Wrap: Stocks, Bonds, Commodities
Stock futures were flat in overnight trading on Wednesday after the market suffered three consecutive days of decline as the tech-powered rally faded.
The Dow Jones Industrial Average fell 102.35 points to 33,951.52, the S&P 500 lose 0.52% to 4,365.69 and the Nasdaq Composite subtract 165.10 points to 13,502.20.
MSCI’s index of Asia-Pacific stocks outside Japan is decline 0.05% to 639.71 levels. The Australian index was lower by 1.63% to 7,195.50. Japanese Nikkei Index decline 0.92% today.
European stocks were negative on Thursday, with the Stoxx Europe 50 Index fell 1.05% to 4,277.15, Germany’s DAX decline 0.72% to 15,909.25, and France’s CAC drop 1.28% to 7,166.67 and U.K.’s FTSE 100 subtract 0.88% to 7,491.97.
Benchmark 10-year U.S. Treasury fell as demand for safe assets ascend again, today 10-year bond yields positive 0.98% to 3.7600.
Oil prices gained a dollar a barrel on Wednesday as the US corn and soybean prices raced to multi-month highs, raising expectations that crop shortfalls around the globe could lower biofuels blending and increase oil demand.
Spot Brent crude oil drop 0.74% to $76.55 per barrel. US West Texas Intermediate crude is down 0.69% to $72.03 a barrel.
The yellow metal gold is decline 0.40% to 1,937.15 dollars per ounce.
Market Wrap: Forex
The U.S. dollar stabilized in early European trade Thursday near a one-month low after the first day of Federal Reserve Chair Jerome Powell’s semi-annual testimony to Congress, while sterling edges lower ahead of the latest Bank of England meeting.
Today, the U.S. dollar index measures the Greenback against a trade-weighted basket of six major currencies, which surged 0.02% to 101.670.
The Euro US Dollar (EUR/USD) is a widely traded pair that is up 0.03% today. This left the pair trading around $1.09930.
The Japanese yen was negative against the U.S. dollar on Thursday. Today USD/JPY is surged 0.07% to the 141.970 level.
Another commodity-related currency mixed against the U.S dollar, AUD/USD fell 0.13% to 0.67870, and NZD/USD surged 0.11% to 0.62080 level.
EUR/USD Intraday: Trend on the upside
Our pivot point is at 1.09750
Preferable Price Action: Take buy positions above pivot level with targets at 1.10000 & 1.10160 in extension.
Alternative Price Action: Below pivot looks for a further downside to 1.09550 & 1.09390.
Comment: RSI is above 50 levels and Pairs above 55MA.
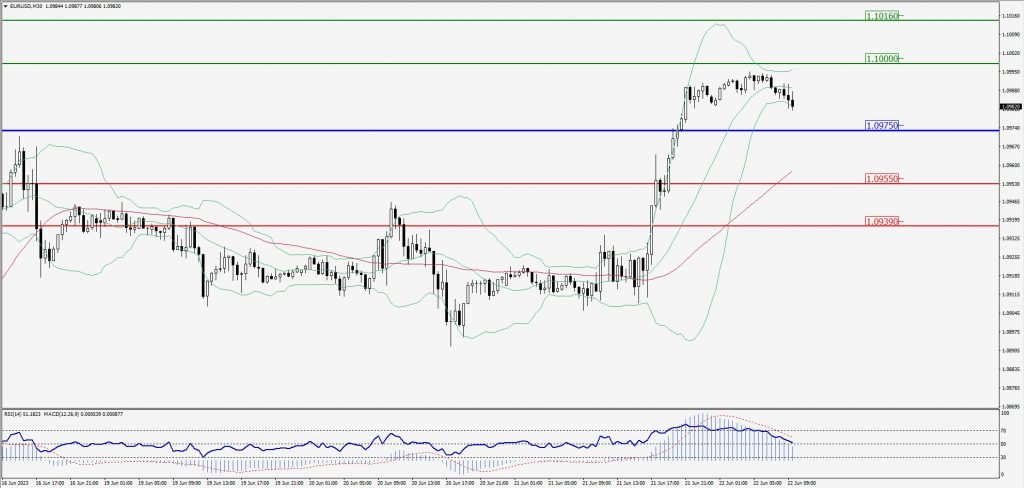
Green Lines Indicate Resistance Levels – Red Lines Indicate Support Levels
Light Blue is a Pivot Point – Black represents the price when the report was produced
GBP/USD Intraday: Trend on the downside
Our pivot point is at 1.27590
Preferable Price Action: Sell positions below pivot with targets at 1.27300 & 1.27100 in extension.
Alternative Price Action: The price above pivot would call for further upside to 1.27850 & 1.28020.
Comment: RSI is below 50 levels and Pairs below its 20MA & 55MA.
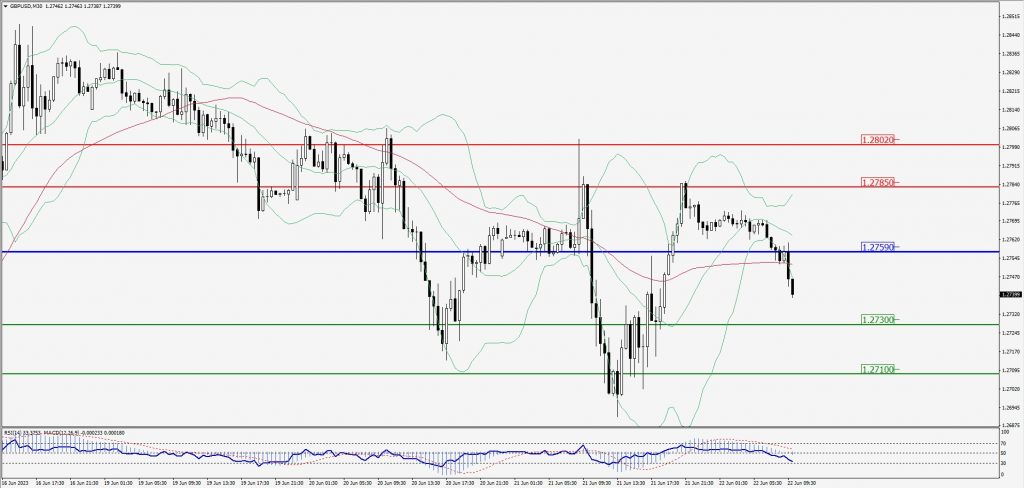
Green Lines Indicate Resistance Levels – Red Lines Indicate Support Levels
Light Blue is a Pivot Point – Black represents the price when the report was produced
USD/JPY Intraday: Support level at 141.780
Our pivot point is at 141.780
Preferable Price Action: Buy position above pivot with the target at 142.120 and 142.360 in extension.
Alternative Price Action: The downside breakout of the pivot would call for 141.470 and 141.230.
Comment: MACD is above 50 level and Pairs above 20MA.
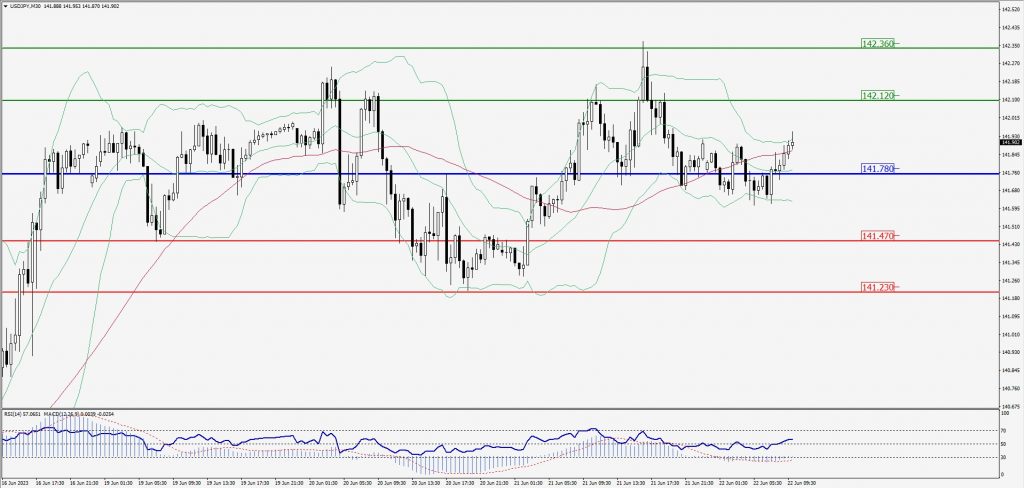
Green Lines Indicate Resistance Levels – Red Lines Indicate Support Levels
Light Blue is a Pivot Point – Black represents the price when the report was produced
AUD/USD Intraday: Trend on the downside
Our pivot point is at 0.67830
Preferable Price Action: Sell positions below pivot with targets at 0.67470 & 0.67260 in extension.
Alternative Price Action: Above pivot looks for a further upside with 0.68130 & 0.68380 as targets.
Comment: RSI is below 50 levels and Pairs below its 20MA & 55MA.
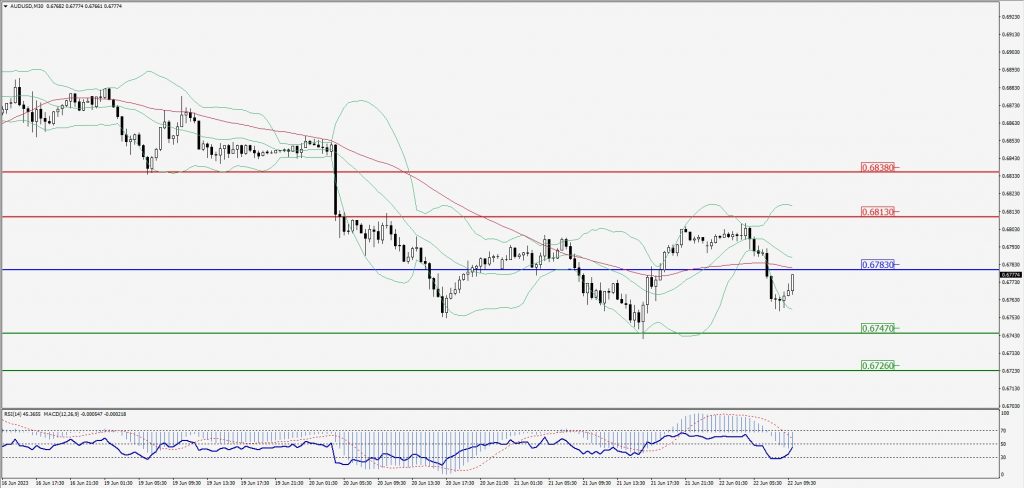
Green Lines Indicate Resistance Levels – Red Lines Indicate Support Levels
Light Blue is a Pivot Point – Black represents the price when the report was produced
CRUDEOIL Intraday: Support level at 72.12
Our pivot point is at 72.12
Preferable Price Action: Above pivot buy oil with 72.79 & 73.21 as targets.
Alternative Price Action: Sell crude below pivot with targets at 71.53 and 71.13 in extension.
Comment: MACD is positive territory and Pairs above its 20MA & 55MA.
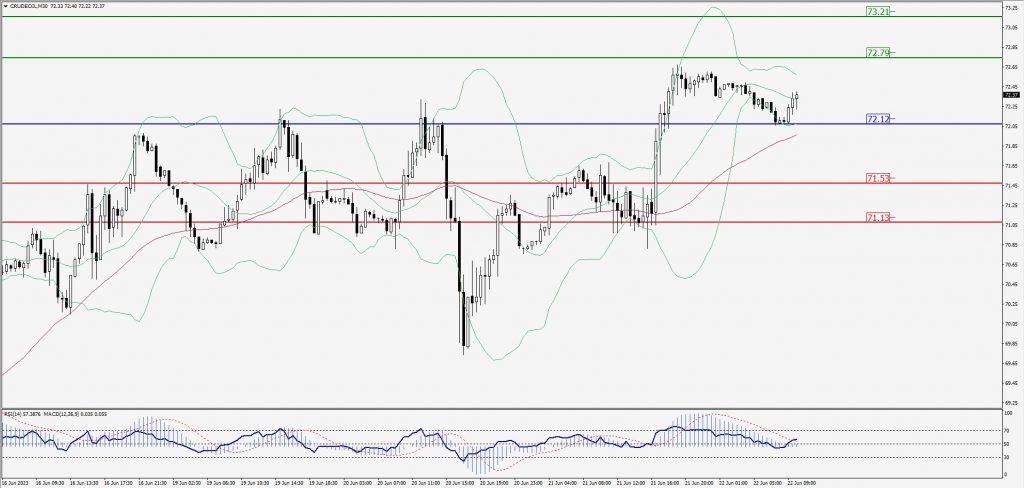
Green Lines Indicate Resistance Levels – Red Lines Indicate Support Levels
Light Blue is a Pivot Point – Black represents the price when the report was produced
XAU/USD Intraday: Resistance level at 1933.80
Our pivot point is 1933.80
Preferable Price Action: Further downside to 1924.60 and 1918.40
Alternative Price Action: If the price gives an upside breakout of a pivot, then the price extends to 1942.40 and 1948.50.
Comment: MACD is below 50 level and Pairs below its 20MA & 55MA.
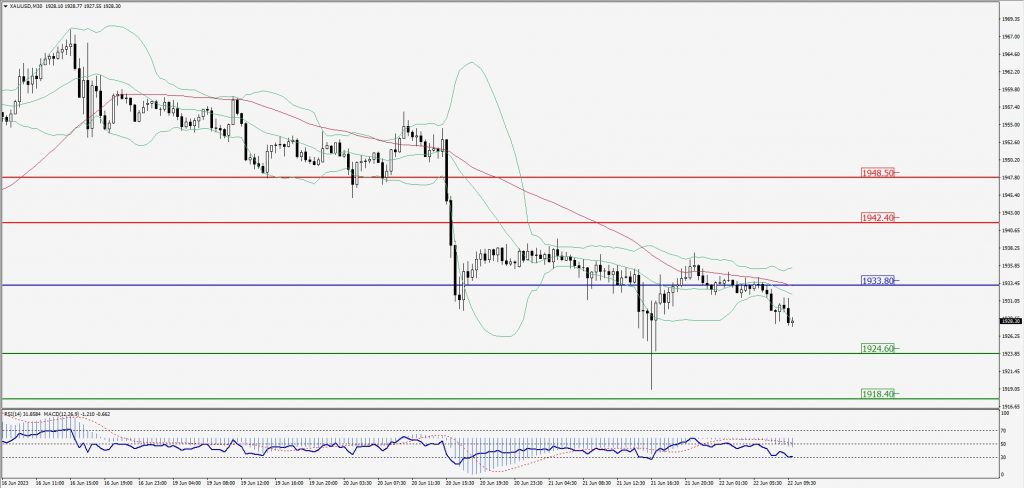
Green Lines Indicate Resistance Levels – Red Lines Indicate Support Levels
Light Blue is a Pivot Point – Black represents the price when the report was produced
Dow Jones Intraday: Trend on the downside
Our pivot point is 33,926.00
Preferable Price Action: Take sell positions below the pivot with targets at 33,786.00 & 33,682.00.
Alternative Price Action: Above 33,926.00 looks for further upside to 34,067.00 & 34,185.00.
Comment: RSI is below 50 levels and Pairs below its 20MA & 55MA.
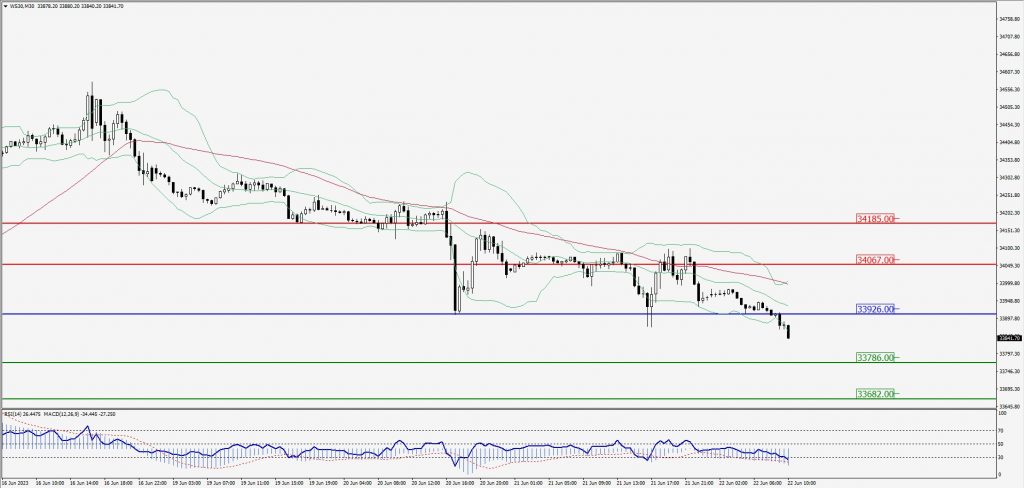
Green Lines Indicate Resistance Levels – Red Lines Indicate Support Levels
Light Blue is a Pivot Point – Black represents the price when the report was produced