Market Wrap: Stocks, Bonds, Commodities
U.S. stocks ended trading on Monday down by more than 1%, pressured lower by surging Omicron coronavirus cases and a possibly fatal blow to a $1.75 trillion U.S. domestic spending bill, with oil prices plunging.
The Dow Jones Industrial Average closed 1.23% lower at 34,932.16, while the S&P 500 ended the day down 1.14% at 4,568.02. The Nasdaq Composite dropped 1.24% to 14,980.94.
MSCI’s index of Asia-Pacific stocks outside Japan advance 0.94% to 768.40 levels. Australian index rose 0.86% to 7,355.00. Japanese Nikkei Index surged 2.08% to 28,517.59.
European stocks were higher on Tuesday, with the Stoxx Europe 50 Index increase 0.85% to 4,143.85, Germany’s DAX gained 0.66% to 15,342.99, and France’s CAC rose 0.80% to 6,925.40, and U.K.’s FTSE 100 advance 0.88% to 7,261.80.
Benchmark 10-year U.S. Treasury rose as demand for safe assets grows again, today 10-year bond yields gain 0.97% to 1.433.
Oil prices edged higher on Tuesday, though investors remained worried about the rapid spread of the Omicron coronavirus variant globally, prompting countries to consider more restrictions potentially denting fuel demand.
Spot Brent crude oil rose 0.89% to $72.18 per barrel. US West Texas Intermediate crude gained 1.27% to $69.49 a barrel.
The yellow metal gold is lost 0.21% to 1,790.90 dollars per ounce.
Market Wrap: Forex
The dollar hovered below recent highs on Tuesday having lost ground overnight after a blow to Democratic spending plans in Washington, but worries about the Omicron coronavirus variant kept risk currencies in check.
Today, the U.S. dollar index measures the greenback against a trade-weighted basket of six major currencies, which slipped 0.05% to 96.495.
The Euro US Dollar (EUR/USD) is a widely traded pair that is rose 0.03% today. This left the pairing trading around $1.12760.
The Japanese yen fell against the U.S. dollar on Tuesday as the stock pushes lower. Today US/JPY is rose 0.15% to 113.740 level.
Another commodity-related currency higher against the U.S dollar, AUD/USD advanced 0.19% to 0.71220, and NZD/USD gained 0.21% to 0.67250 level.
EUR/USD Intraday: Support at 1.12700
Our pivot point is at 1.12700
Preferable Price Action: Take Long positions Above pivot level with targets at 1.13060 & 1.13300 in extension.
Alternative Price Action: Below pivot looks for a further Downside to 1.12330 & 1.12090.
Comment: Pair above 55MA and RSI at 50 levels.
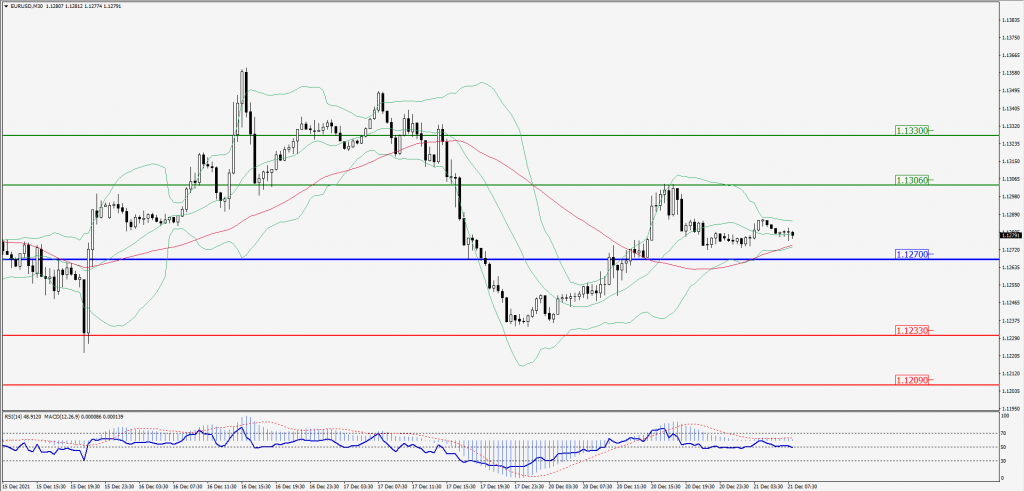
Green Lines Indicate Resistance Levels – Red Lines Indicates Support Levels
Light Blue is a Pivot Point – Black represents the price when the report was produced
GBP/USD Intraday: In a consolidation zone
Our pivot point is at 1.32030
Preferable Price Action: Buy positions above pivot with targets at 1.32660 & 1.32990 in extension.
Alternative Price Action: The price below pivot would call for further downside to 1.31460 & 1.31130.
Comment: Pair above its 55MA & 20MA and RSI above 50 levels.
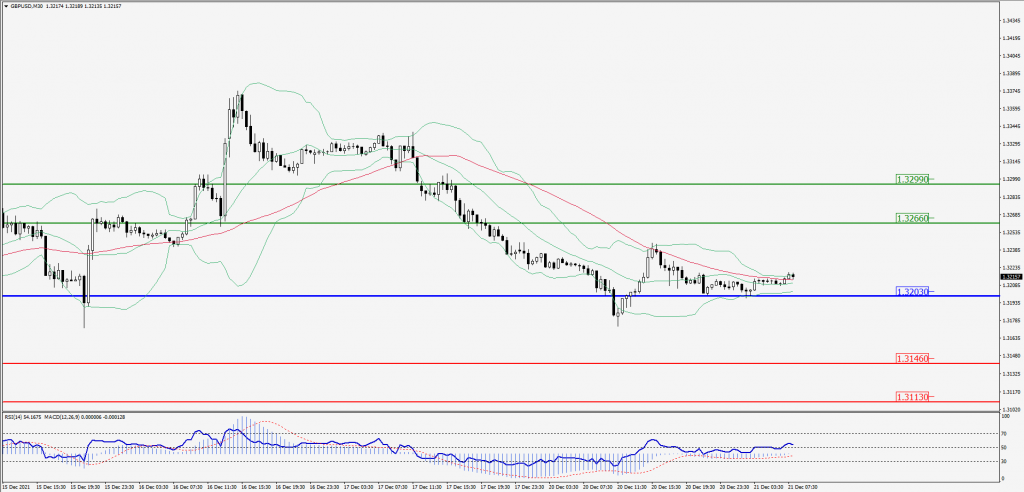
Green Lines Indicate Resistance Levels – Red Lines Indicates Support Levels
Light Blue is a Pivot Point – Black represents the price when the report was produced
USD/JPY Intraday: In a consolidation zone
Our pivot point is at 113.630
Preferable Price Action: Buy position Above pivot with the target at 113.990 and 114.190 in extension.
Alternative Price Action: The Downside breakout of the pivot would call for 113.260 and 113.090.
Comment: Price above its 55MA & 20MA and MACD in positive territory.
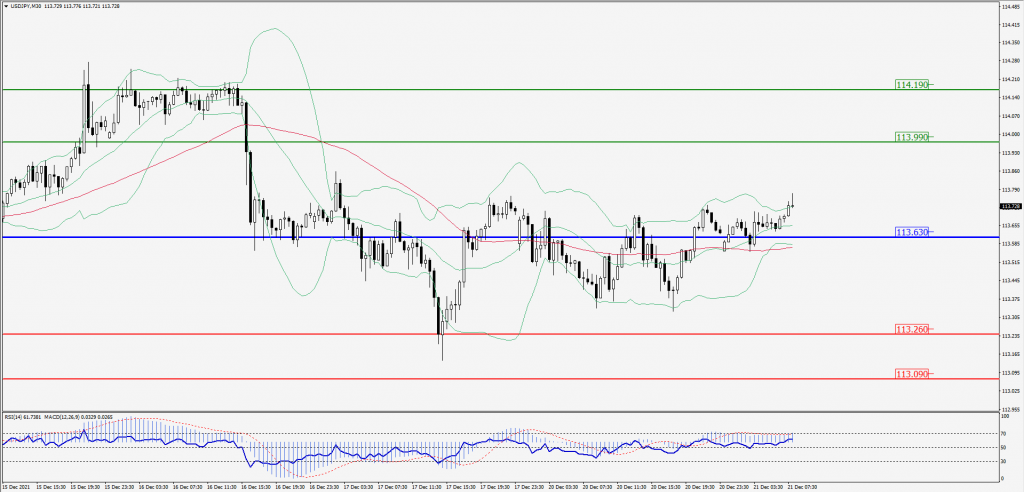
Green Lines Indicate Resistance Levels – Red Lines Indicates Support Levels
Light Blue is a Pivot Point – Black represents the price when the report was produced
AUD/USD Intraday: Support at 0.71030
Our pivot point is at 0.71030
Preferable Price Action: Buy Positions pivot with targets at 0.71530 & 0.71860 in extension.
Alternative Price Action: Below pivot looks for a further downside with 0.70590 & 0.70330 as targets.
Comment: Pair above its 55MA & 20MA and RSI above 50 levels.
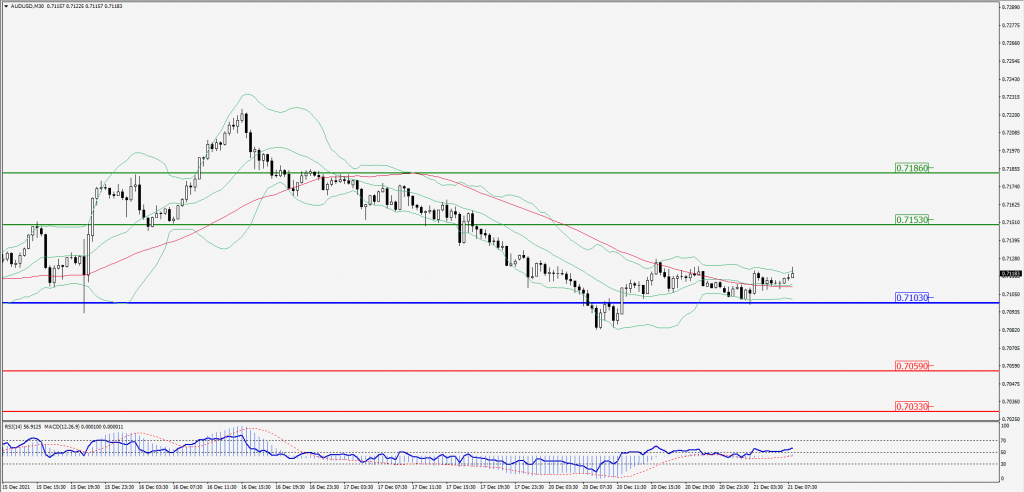
Green Lines Indicate Resistance Levels – Red Lines Indicates Support Levels
Light Blue is a Pivot Point – Black represents the price when the report was produced
CRUDEOIL Intraday: Trend on the upside
Our pivot point is at 68.90
Preferable Price Action: Above pivots Buy Oil with 71.60 & 72.90 as targets.
Alternative Price Action: Sell crude Below pivot with targets at 66.60 and 65.30 in extension.
Comment: Crude is above its 20MA and MACD in the positive territory.
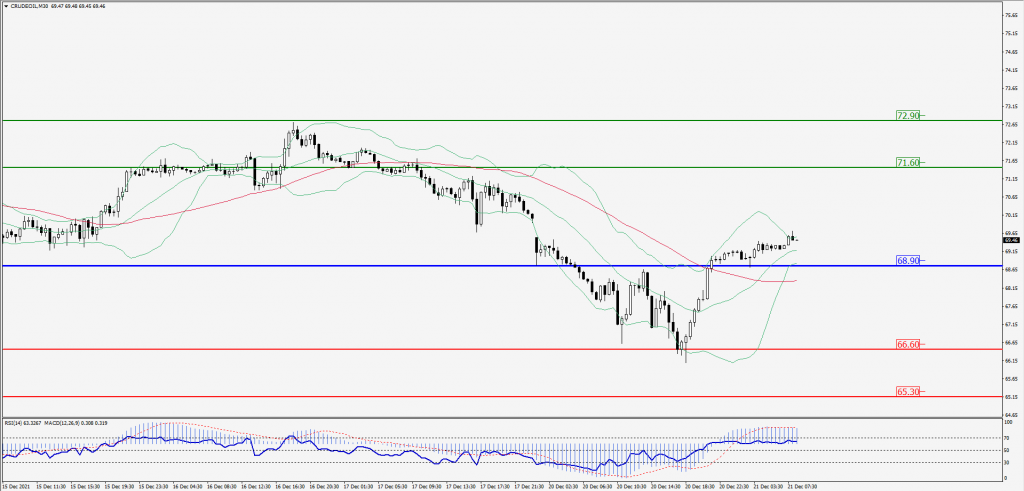
Green Lines Indicate Resistance Levels – Red Lines Indicates Support Levels
Light Blue is a Pivot Point – Black represents the price when the report was produced
XAU/USD Intraday: Resistance at 1796.00
Our pivot point is 1796.90
Preferable Price Action: Further Downside to 1780.90 and 1770.00.
Alternative Price Action: If the price gives a upside breakout of a pivot, then the price extends to 1812.00 and 1820.00.
Comment: MACD in negative territory and price below its 20MA & 55MA.
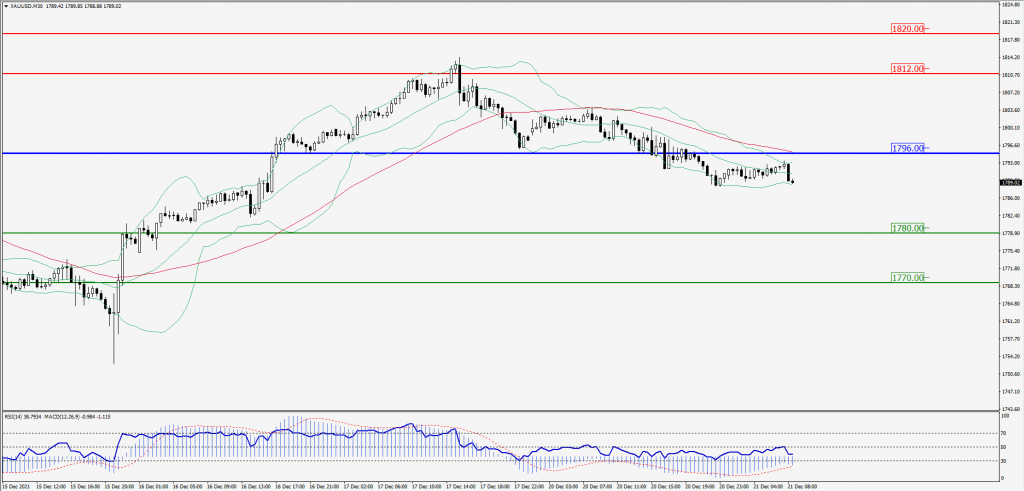
Green Lines Indicate Resistance Levels – Red Lines Indicates Support Levels
Light Blue is a Pivot Point – Black represents the price when the report was produced
Dow Jones Intraday: Break Resistance level
Our pivot point is 35,030.00
Preferable Price Action: Take Long positions above pivot with targets at 35,660.00 & 36,060.00.
Alternative Price Action: Below 35,030.00 looks for further Downside to 34,430.00 & 34,060.00.
Comment: Price above its 55MA & 20MA and RSI above 50 levels.
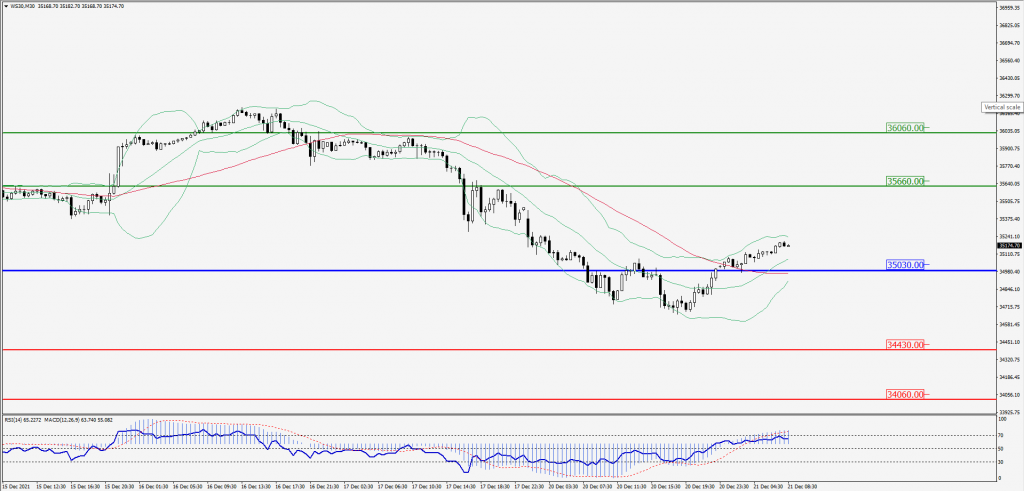
Green Lines Indicate Resistance Levels – Red Lines Indicates Support Levels
Light Blue is a Pivot Point – Black represents the price when the report was produced