Market Wrap: Stocks, Bonds, Commodities
Wall Street’s main indices closed sharply higher on Tuesday, with strength in travel and tech shares as well as in Nike and Micron Technology, following their earnings, as stocks rebounded from a Coronavirus-fuelled rout the session before.
The Dow Jones Industrial Average rose 560.54 points (1.60%) to 35,492.7, the S&P 500 gained 81.21 points (1.78%) to 4,649.23 and the Nasdaq Composite added 360.14 points (2.40%) to 15,341.09.
MSCI’s index of Asia-Pacific stocks outside Japan advance 0.36% to 773.36 levels. Australian index rose 0.13% to 7,364.80. Japanese Nikkei Index surged 0.16% to 28,562.21.
European stocks were lower on Wednesday, with the Stoxx Europe 50 Index dropped 0.11% to 4,143.85, Germany’s DAX fell 0.12% to 15,433.56, and France’s CAC rose 0.09% to 6,971.41, and U.K.’s FTSE 100 lossed 0.25% to 7,279.45.
Benchmark 10-year U.S. Treasury rose as demand for safe assets grows again, today 10-year bond yields slumped 1.82% to 1.460.
Oil prices rose again on Wednesday as the dollar slipped, with risk appetite returning as some governments resist imposing lockdowns to curb the spread of the Omicron COVID-19 variant and as China said it would be able to sustain economic growth.
Spot Brent crude oil rose 0.27% to $71.31 per barrel. US West Texas Intermediate crude gained 0.05% to $74.00 a barrel.
The yellow metal gold is lost 0.05% to 1,787.85 dollars per ounce.
Market Wrap: Forex
The dollar edged down again in early Asia on Wednesday, starting a third successive session under pressure as investors favored riskier currencies and asset classes.
Today, the U.S. dollar index measures the greenback against a trade-weighted basket of six major currencies, which gained 0.06% to 96.540.
The Euro US Dollar (EUR/USD) is a widely traded pair that is fell 0.10% today. This left the pairing trading around $1.12710.
The Japanese yen fell against the U.S. dollar on Wednesday as the stock pushes higher. Today US/JPY is rose 0.06% to 114.120 level.
Another commodity-related currency lower against the U.S dollar, AUD/USD lost 0.36% to 0.71280, and NZD/USD down 0.27% to 0.67430 level.
EUR/USD Intraday: Resistance at 1.12930
Our pivot point is at 1.12930
Preferable Price Action: Take Short positions Below pivot level with targets at 1.12560 & 1.12360 in extension.
Alternative Price Action: Above pivot looks for a further Upside to 1.13260 & 1.13490.
Comment: Pair below 55MA & 20MA and RSI below 50 levels.
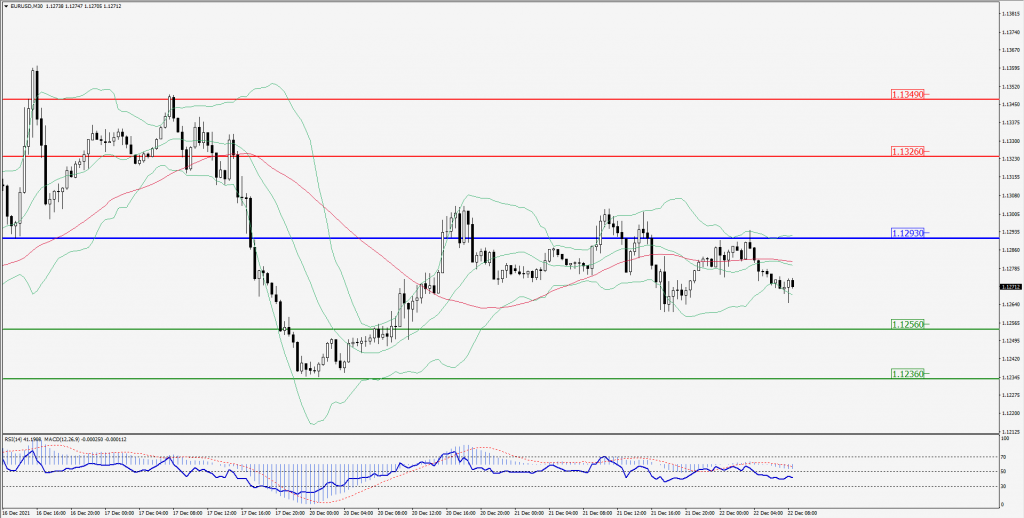
Green Lines Indicate Resistance Levels – Red Lines Indicates Support Levels
Light Blue is a Pivot Point – Black represents the price when the report was produced
GBP/USD Intraday: Support at 1.32360
Our pivot point is at 1.32360
Preferable Price Action: Buy positions above pivot with targets at 1.33030 & 1.33430 in extension.
Alternative Price Action: The price below pivot would call for further downside to 1.31690 & 1.31290.
Comment: Pair above its 55MA and RSI below 50 levels.
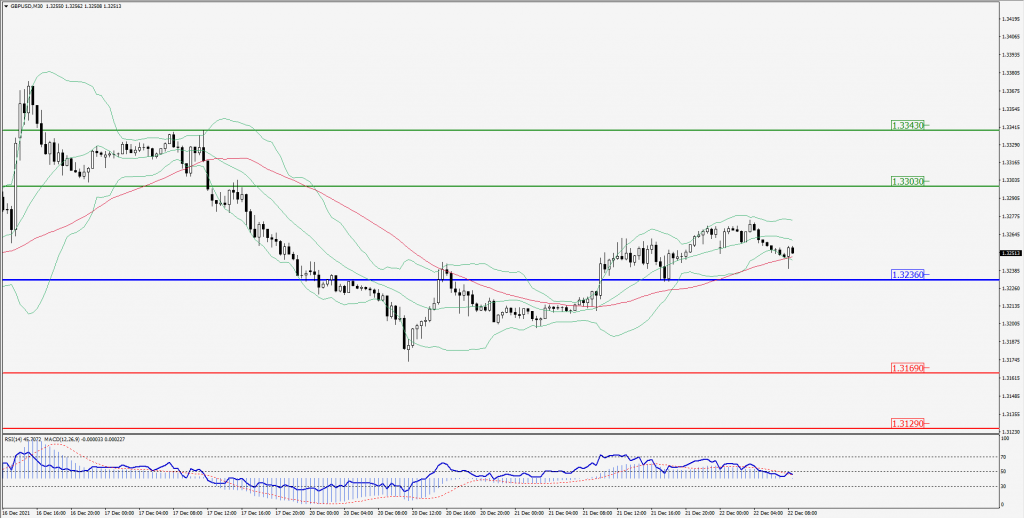
Green Lines Indicate Resistance Levels – Red Lines Indicates Support Levels
Light Blue is a Pivot Point – Black represents the price when the report was produced
USD/JPY Intraday: Support Level at 113.990
Our pivot point is at 113.990
Preferable Price Action: Buy position Above pivot with the target at 114.460 and 114.730 in extension.
Alternative Price Action: The Downside breakout of the pivot would call for 113.560 and 113.290.
Comment: Price above its 55MA & 20MA and MACD in positive territory.
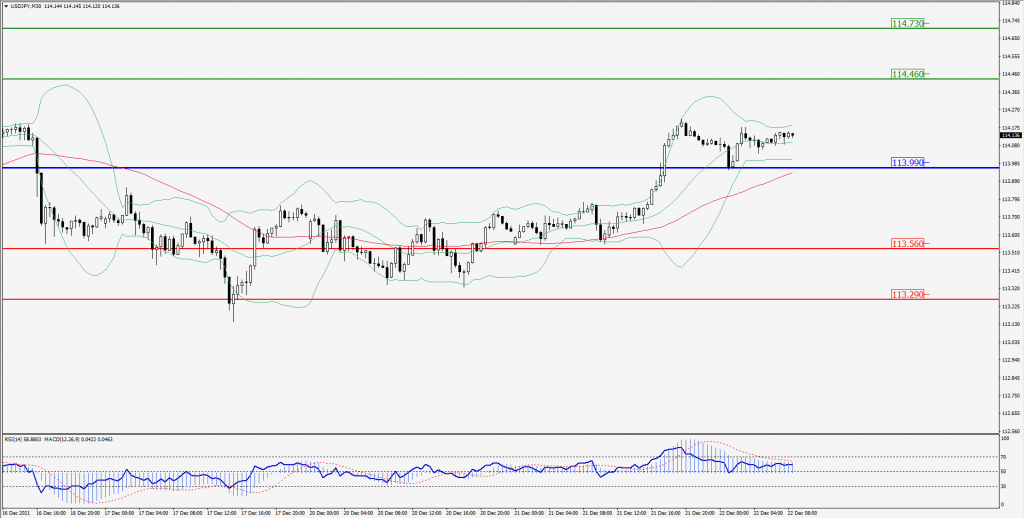
Green Lines Indicate Resistance Levels – Red Lines Indicates Support Levels
Light Blue is a Pivot Point – Black represents the price when the report was produced
AUD/USD Intraday: Support at 0.71160
Our pivot point is at 0.71160
Preferable Price Action: Buy Positions pivot with targets at 0.71600 & 0.71860 in extension.
Alternative Price Action: Below pivot looks for a further downside with 0.70730 & 0.70490 as targets.
Comment: Pair below its 55MA & 20MA and RSI below 50 levels.
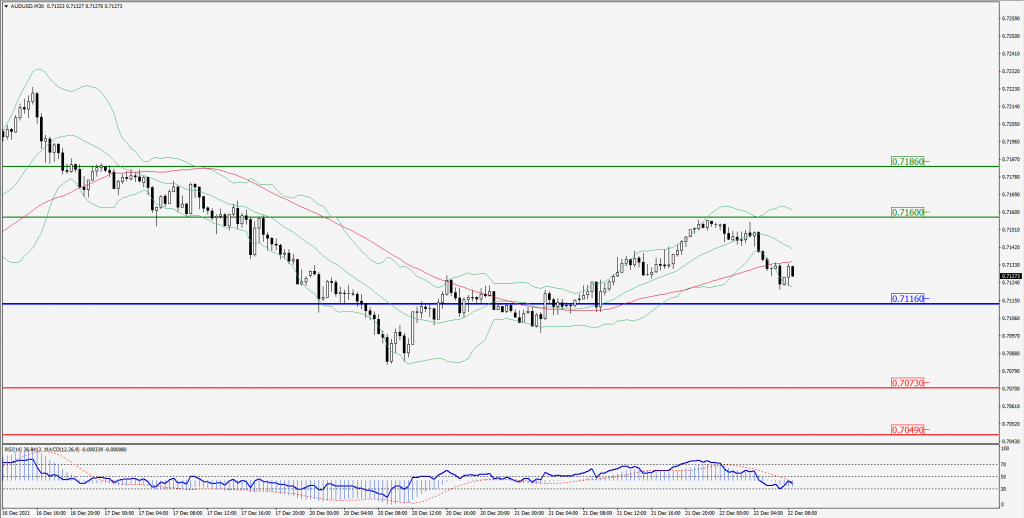
Green Lines Indicate Resistance Levels – Red Lines Indicates Support Levels
Light Blue is a Pivot Point – Black represents the price when the report was produced
CRUDEOIL Intraday: Trend on the upside
Our pivot point is at 70.50
Preferable Price Action: Above pivots Buy Oil with 72.60 & 73.60 as targets.
Alternative Price Action: Sell crude Below pivot with targets at 68.60 and 67.60 in extension.
Comment: Crude is above its 55MA and MACD in the positive territory.
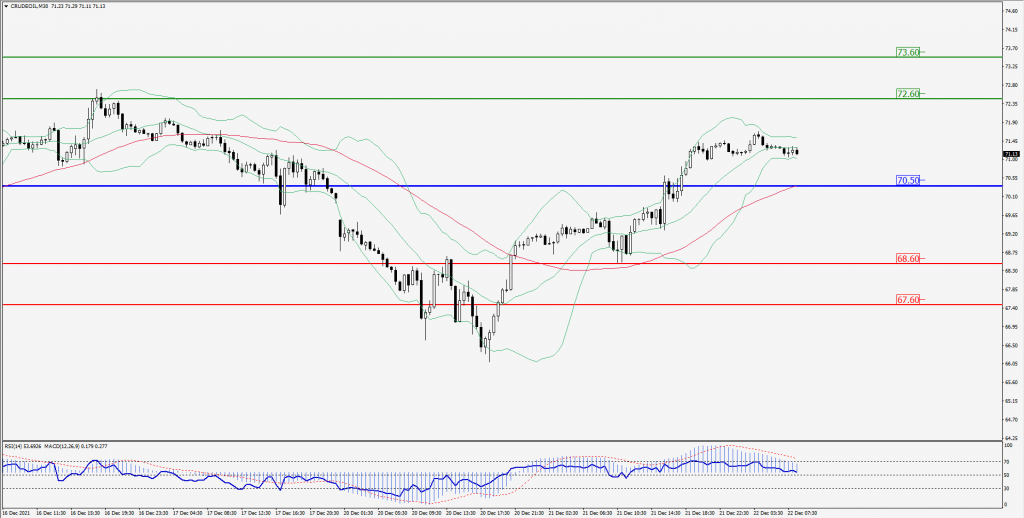
Green Lines Indicate Resistance Levels – Red Lines Indicates Support Levels
Light Blue is a Pivot Point – Black represents the price when the report was produced
XAU/USD Intraday: Trend on the downside
Our pivot point is 1794.00
Preferable Price Action: Further Downside to 1782.00 and 1774.00.
Alternative Price Action: If the price gives an upside breakout of a pivot, then the price extends to 1806.00 and 1813.00.
Comment: MACD in negative territory and price below its 20MA & 55MA.
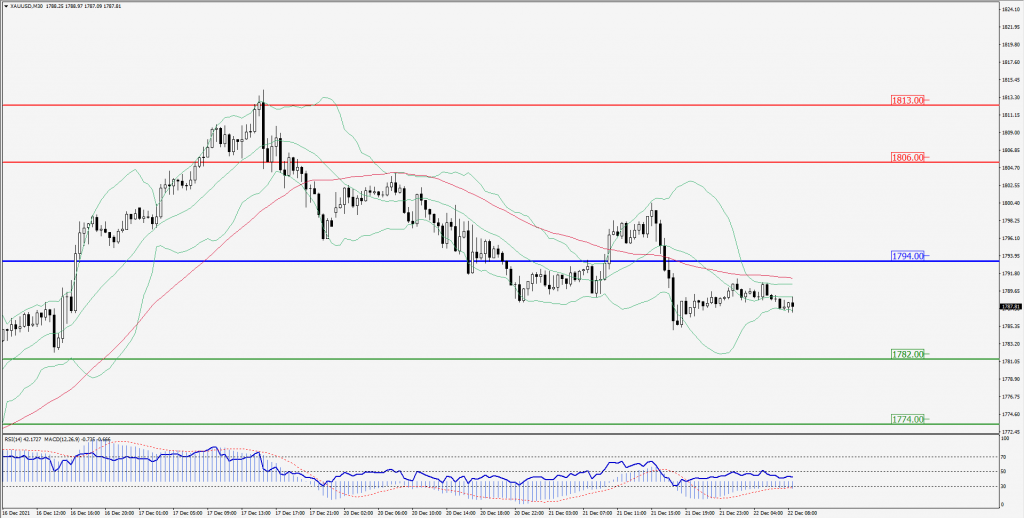
Green Lines Indicate Resistance Levels – Red Lines Indicates Support Levels
Light Blue is a Pivot Point – Black represents the price when the report was produced
Dow Jones Intraday: Trend on the upside
Our pivot point is 35,330.00
Preferable Price Action: Take Long positions above pivot with targets at 35,966.00 & 36,269.00.
Alternative Price Action: Below 35,030.00 looks for further Downside to 34,730.00 & 34,460.00.
Comment: Price above its 55MA and RSI above 50 levels.
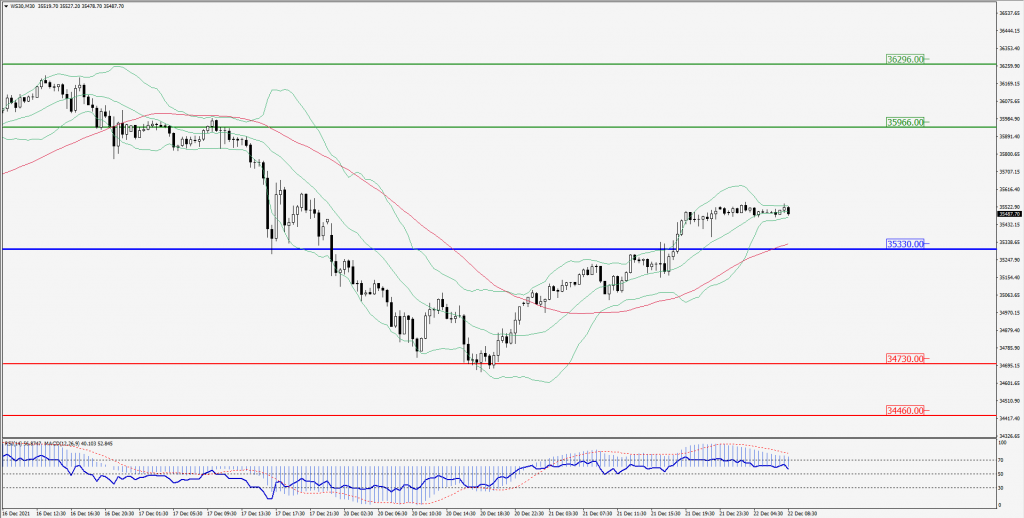
Green Lines Indicate Resistance Levels – Red Lines Indicates Support Levels
Light Blue is a Pivot Point – Black represents the price when the report was produced