Market Wrap: Stocks, Bonds, Commodities
Wall Street finished lower on Friday, weighed down by Big Tech as investors worried about the Omicron coronavirus variant and digested the Federal Reserve’s decision to end its pandemic-era stimulus faster.
In Friday’s session, the Dow Jones Industrial Average slipped 1.48% to end at 35,365.44 points, while the S&P 500 fell 1.03% to 4,620.64. The Nasdaq Composite dropped 0.07% to 15,169.68
MSCI’s index of Asia-Pacific stocks outside Japan plunged 1.68% to 764.85 levels. Australian index slipped 0.16% to 7,292.20. Japanese Nikkei Index slumped 2.17% to 27,944.50.
European stocks were lower on Monday, with the Stoxx Europe 50 Index fell 2.53% to 4,055.65, Germany’s DAX lost 2.87% to 15,085.32, and France’s CAC slipped 2.21% to 6,765.33, and U.K.’s FTSE 100 lost 2.22% to 7,108.30.
Benchmark 10-year U.S. Treasury rose as demand for safe assets grows again, today 10-year bond yields fell 2.17% to 1.372.
Oil prices slumped by about 2% early on Monday as surging cases of the Omicron coronavirus variant in Europe and the United States stoked investor worries that new restrictions on businesses to combat its spread may hit fuel demand.
Spot Brent crude oil down 3.35% to $71.06 per barrel. US West Texas Intermediate crude lost 3.95% to $68.06 a barrel.
The yellow metal gold is lost 0.16% to 1,802.05 dollars per ounce.
Market Wrap: Forex
The dollar was up on Monday morning in Asia as the U.S. Federal Reserve signaled an earlier interest rate hike of March 2022, while Europe grapples with surging Omicron.
Today, the U.S. dollar index measures the greenback against a trade-weighted basket of six major currencies, which rose 0.05% to 96.565.
The Euro US Dollar (EUR/USD) is a widely traded pair that is rose 0.13% today. This left the pairing trading around $1.12530.
The Japanese yen rose against the U.S. dollar on Monday as the stock pushes lower. Today US/JPY is fell 0.18% to 113.450 level.
Another commodity-related currency lower against the U.S dollar, AUD/USD slipped 0.40% to 0.70950, and NZD/USD declined 0.33% to 0.67130 level.
EUR/USD Intraday: Support at 1.12360
Our pivot point is at 1.12360
Preferable Price Action: Take Long positions Above pivot level with targets at 1.12890 & 1.13190 in extension.
Alternative Price Action: Below pivot looks for a further Downside to 1.11960 & 1.11660.
Comment: Pair above 20MA and RSI above 50 levels.
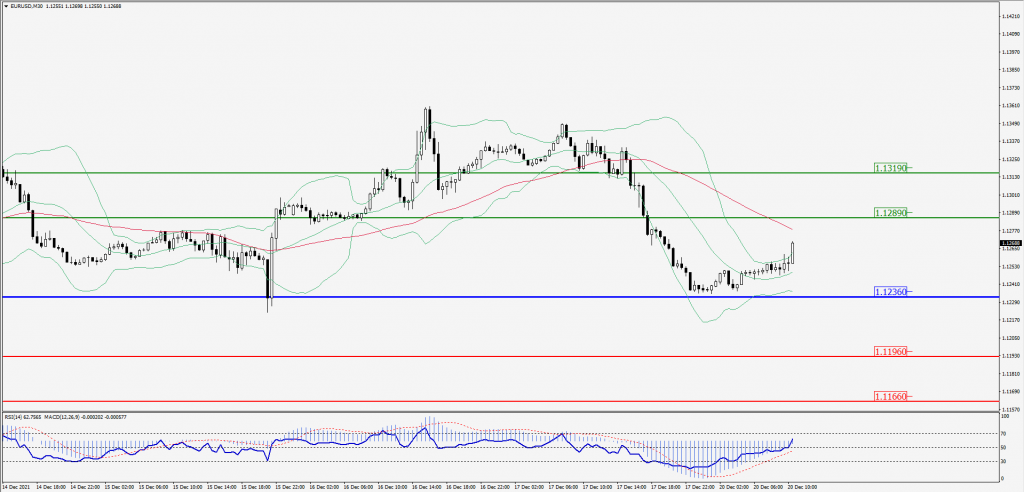
Green Lines Indicate Resistance Levels – Red Lines Indicates Support Levels
Light Blue is a Pivot Point – Black represents the price when the report was produced
GBP/USD Intraday: Trend on the downside
Our pivot point is at 1.32490
Preferable Price Action: Sell positions below pivot with targets at 1.31800 & 1.31490 in extension.
Alternative Price Action: The price above pivot would call for further upside to 1.33030 & 1.33330.
Comment: Pair below its 55MA & 20MA and RSI below 50 levels.
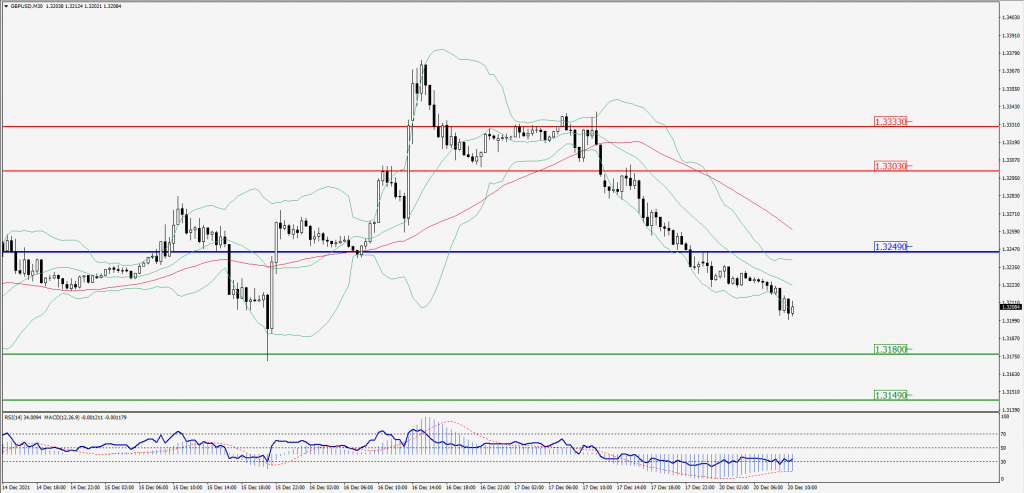
Green Lines Indicate Resistance Levels – Red Lines Indicates Support Levels
Light Blue is a Pivot Point – Black represents the price when the report was produced
USD/JPY Intraday: In a consolidation zone
Our pivot point is at 113.630
Preferable Price Action: Sell position Below pivot with the target at 113.230 and 113.060 in extension.
Alternative Price Action: The Upside breakout of the pivot would call for 113.960 and 114.160.
Comment: Price below its 55MA & 20MA and MACD in negative territory.
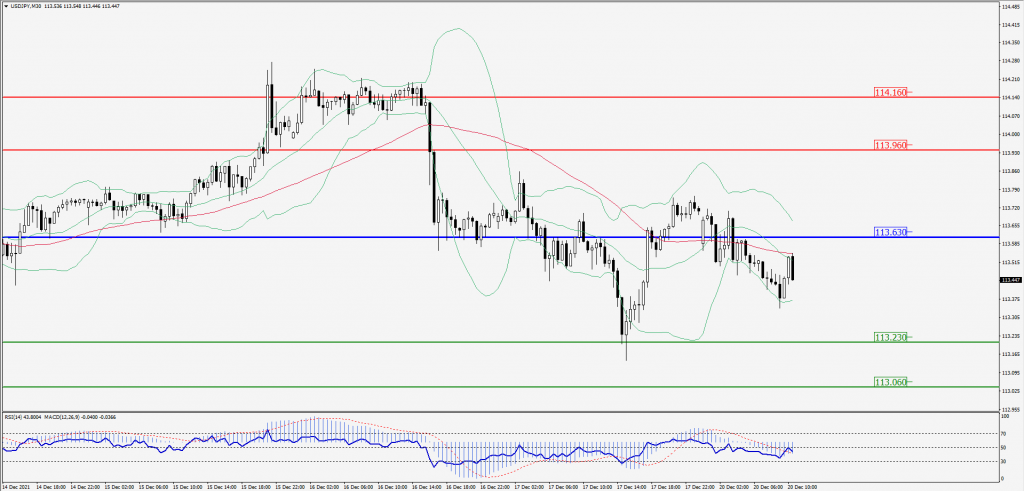
Green Lines Indicate Resistance Levels – Red Lines Indicates Support Levels
Light Blue is a Pivot Point – Black represents the price when the report was produced
AUD/USD Intraday: Trend on the downside
Our pivot point is at 0.71190
Preferable Price Action: Sell Positions below pivot with targets at 0.70630 & 0.70360 in extension.
Alternative Price Action: Above pivot looks for a further upside with 0.71700 & 0.71990 as targets.
Comment: Pair below its 55MA & 20MA and RSI below 50 levels.
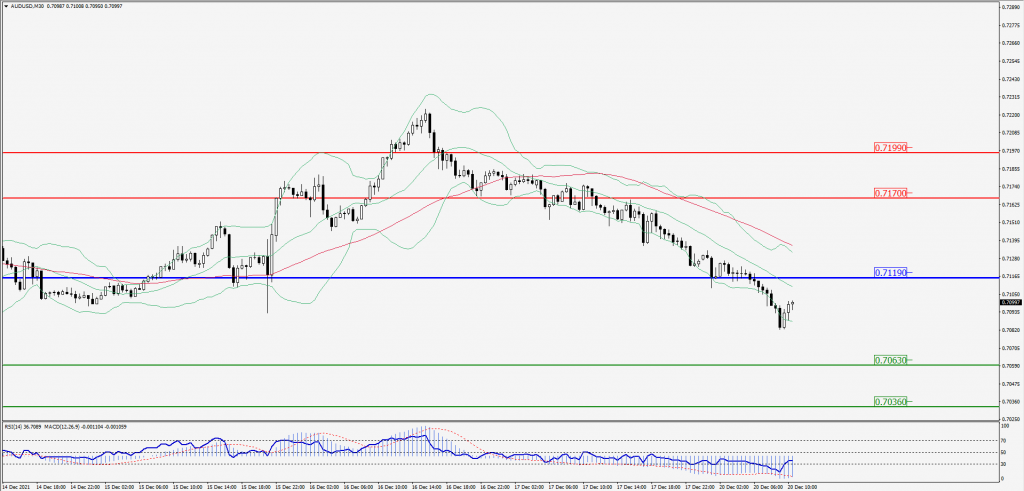
Green Lines Indicate Resistance Levels – Red Lines Indicates Support Levels
Light Blue is a Pivot Point – Black represents the price when the report was produced
CRUDEOIL Intraday: Trend on the downside
Our pivot point is at 69.30
Preferable Price Action: Below pivots Sell Oil with 66.60 & 65.30 as targets.
Alternative Price Action: Buy crude Above pivot with targets at 71.30 and 72.90 in extension.
Comment: Crude is below its 20MA and MACD in the negative territory.
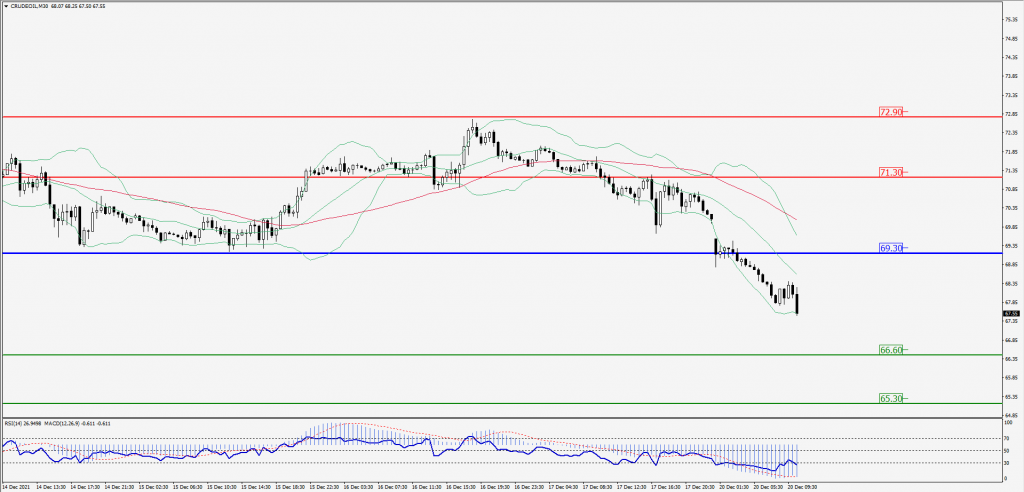
Green Lines Indicate Resistance Levels – Red Lines Indicates Support Levels
Light Blue is a Pivot Point – Black represents the price when the report was produced
XAU/USD Intraday: Support at 1795.90
Our pivot point is 1795.90
Preferable Price Action: Further Upside to 1810.90 and 1819.30.
Alternative Price Action: If the price gives a downside breakout of a pivot, then the price extends to 1780.30 and 1771.30.
Comment: MACD in positive territory and price below its 20MA & 55MA.
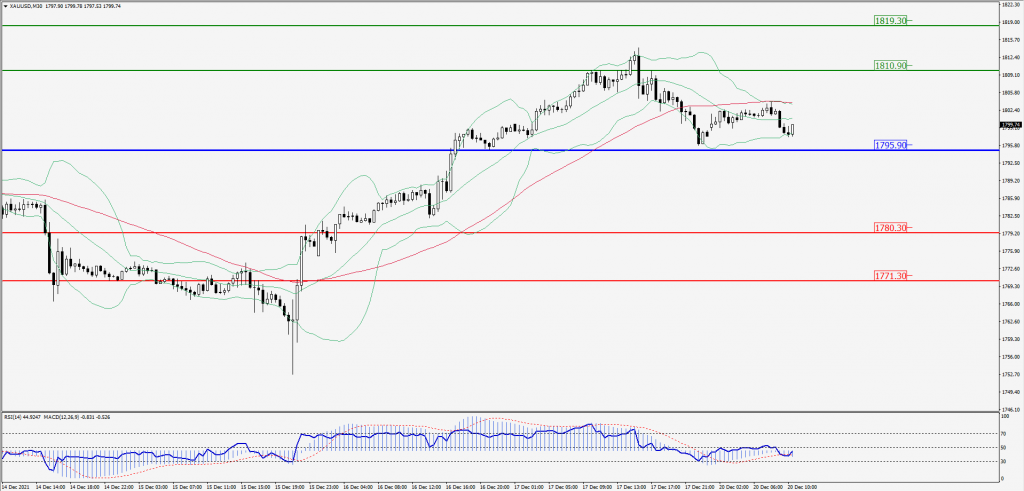
Green Lines Indicate Resistance Levels – Red Lines Indicates Support Levels
Light Blue is a Pivot Point – Black represents the price when the report was produced
Dow Jones Intraday: Trend on the downside
Our pivot point is 35,330.00
Preferable Price Action: Take Short positions below pivot with targets at 34,660.00 & 34,260.00.
Alternative Price Action: Above 35,330.00 looks for further Upside to 35,960.00 & 36,300.00.
Comment: Price below its 55MA & 20MA and RSI below 50 levels.
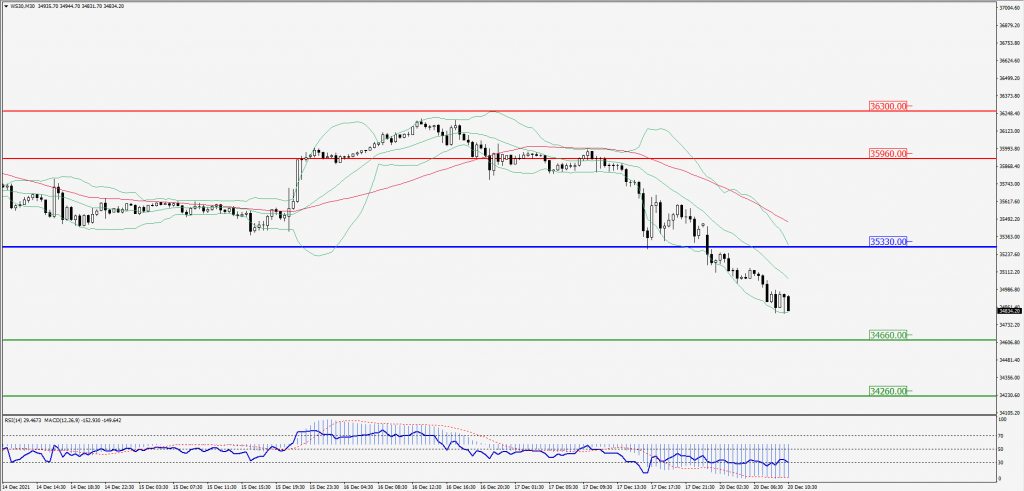
Green Lines Indicate Resistance Levels – Red Lines Indicates Support Levels
Light Blue is a Pivot Point – Black represents the price when the report was produced