Market Wrap: Stocks, Bonds, Commodities
The S&P and Nasdaq closed higher on Monday with the biggest boosts from the highest-profile technology and communications companies while investors eyed product news from Apple Inc and appeared optimistic about the third-quarter earnings season.
The Dow Jones Industrial Average slipped 36.15 points (0.10%) to 35,258.61, the S&P 500 advance 15.09 points (0.34%) to 4,486.46 and the Nasdaq Composite gained 124.47 points (0.84%) to 15,021.81.
Asian shares advanced on Tuesday, supported by a tech-driven Wall Street rally, and a rebound in Chinese markets a day after weak data heightened investor concerns about the world’s second-largest economy.
MSCI’s index of Asia-Pacific stocks outside Japan is advancing 1.15% to 826.95 levels. Australian index fell 0.10% to 7,374.90. Japanese Nikkei Index advances 0.65% to 29,215.52.
European stocks were higher on Tuesday, with the Stoxx Europe 50 Index rose 0.20% to 4,159.65, Germany’s DAX gained 0.13% to 15,494.30, and France’s CAC up 0.10% to 6,690.50, and U.K.’s FTSE 100 jumped 0.10% to 7,210.70.
Benchmark 10-year U.S. Treasury rose as demand for safe assets grows again, today 10-year bond yields down 0.64% to 1.574.
Oil prices pulled back after touching multi-year highs on Monday, trading mixed as US industrial output for September fell, tempering early enthusiasm about demand.
Spot Brent crude oil gained 0.49% to $84.73 per barrel. US West Texas Intermediate crude rose 0.65% to $82.22 a barrel.
The yellow metal traded 0.79% higher to 1779.65 dollars per ounce.
Market Wrap: Forex
The dollar languished near the bottom of its recent range against major peers on Tuesday, knocked back by weak U.S. factory data overnight and on market wagers of faster normalisation of monetary policy in other countries.
Today, the U.S. dollar index measures the greenback against a trade-weighted basket of six major currencies, which slipped 0.33% to 93.635.
The Euro US Dollar (EUR/USD) is a widely traded pair that is gained 0.35% today. This left the pairing trading around $1.16480.
The Japanese yen rose against the U.S. dollar on Tuesday as the stock pushes higher. Today US/JPY is down 0.23% to 114.030 level.
Another commodity-related currency higher against the U.S dollar, AUD/USD rose 0.82% to 0.74700, and NZD/USD up 0.93% to 0.71470 level.
EUR/USD Intraday: Break Resistance level
Our pivot point is at 1.16308
Preferable Price Action: Take long positions above pivot level with targets at 1.16747 & 1.17016 in extension.
Alternative Price Action: Below pivot looks for a further downside to 1.15863 & 1.15612.
Comment: Pair above its 55MA & 20MA and RSI above 50 levels.
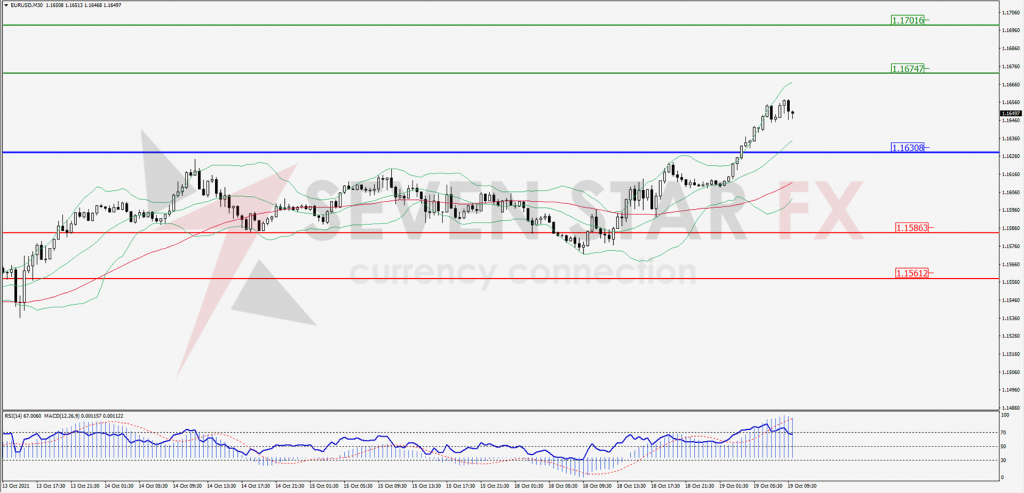
Green Lines Indicate Resistance Levels – Red Lines Indicates Support Levels
Light Blue is a Pivot Point – Black represents the price when the report was produced
GBP/USD Intraday: Trend on the upside
Our pivot point is at 1.37256
Preferable Price Action: Buy positions above pivot with targets at 1.38072 & 1.38448 in extension.
Alternative Price Action: The price below pivot would call for further downside to 1.36477 & 1.36106.
Comment: Pair above its 50MA & 20MA and RSI above 50 levels.
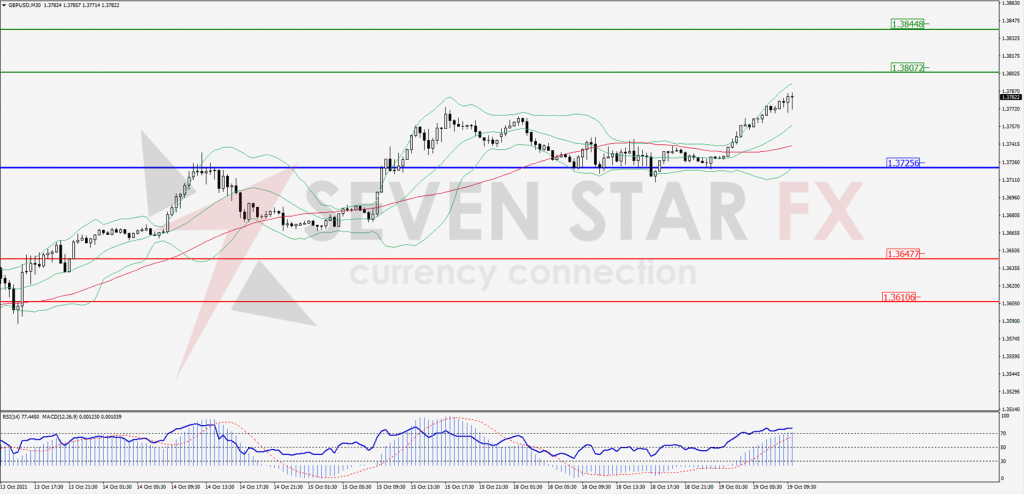
Green Lines Indicate Resistance Levels – Red Lines Indicates Support Levels
Light Blue is a Pivot Point – Black represents the price when the report was produced
USD/JPY Intraday: Resistance at 114.289
Our pivot point is at 114.289
Preferable Price Action: Sell position below pivot with the target at 113.561 and 113.260 in extension.
Alternative Price Action: The upside breakout of the pivot would call for 115.043 and 115.345.
Comment: Price below its 55MA & 20MA and MACD in negative territory.
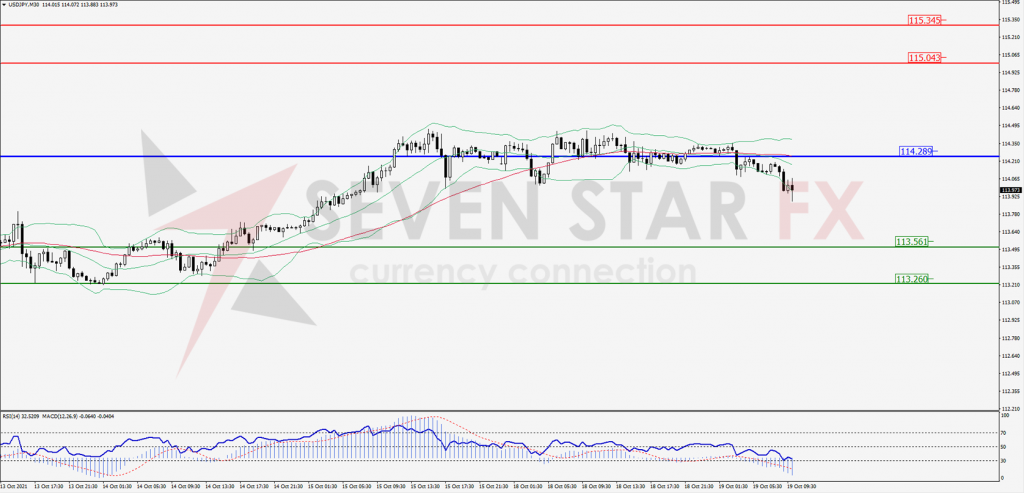
Green Lines Indicate Resistance Levels – Red Lines Indicates Support Levels
Light Blue is a Pivot Point – Black represents the price when the report was produced
AUD/USD Intraday: Support at 0.74384
Our pivot point is at 0.74384
Preferable Price Action: Buy Positions above pivot with targets at 0.74984 & 0.75256 in extension.
Alternative Price Action: Below pivot looks for a further downside with 0.73813 & 0.73517 as targets.
Comment: Pair above its 55MA & 20MA and RSI at oversold levels.
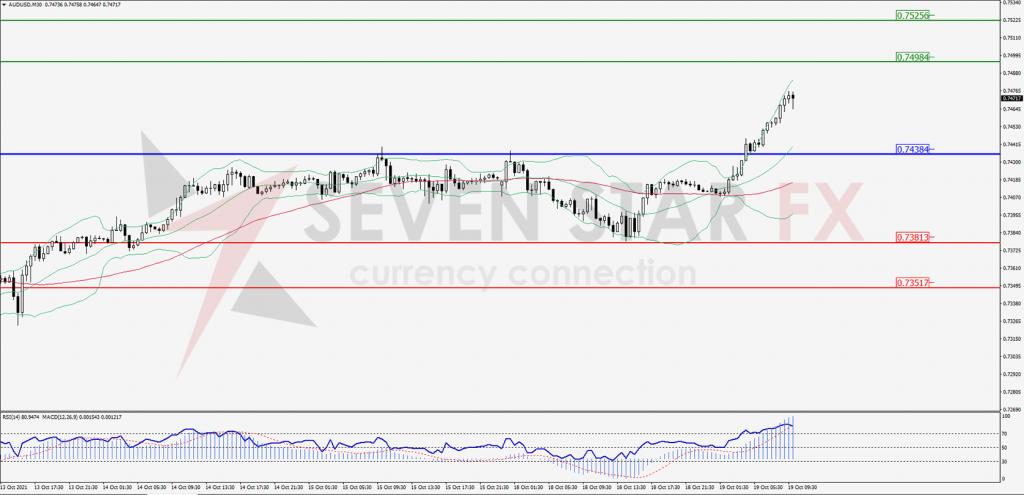
Green Lines Indicate Resistance Levels – Red Lines Indicates Support Levels
Light Blue is a Pivot Point – Black represents the price when the report was produced
CRUDEOIL Intraday: Support at 81.57
Our pivot point is at 81.57
Preferable Price Action: Above pivots buy Oil with 83.34 & 84.28 as targets.
Alternative Price Action: Sell crude below pivot with targets at 79.91 and 79.04 in extension.
Comment: Crude is above its 55MA & 20MA and MACD in the positive territory.
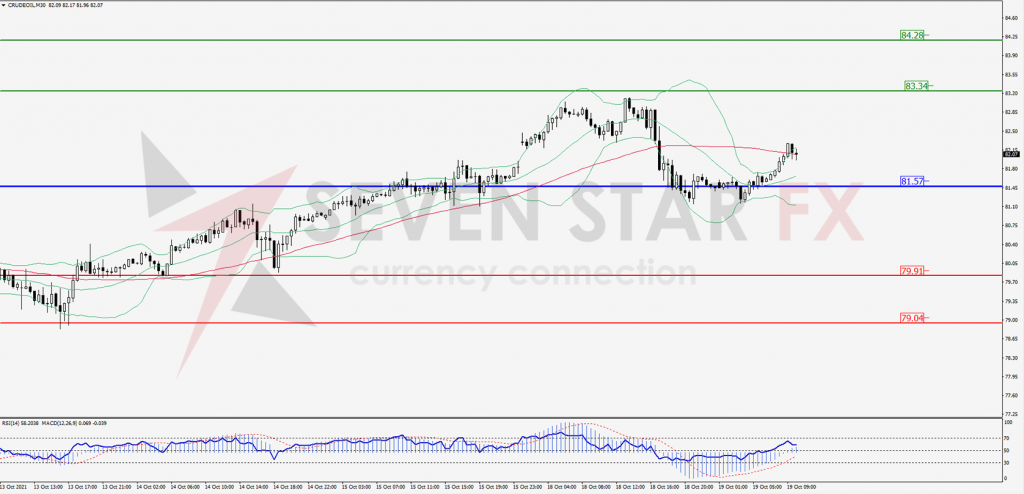
Green Lines Indicate Resistance Levels – Red Lines Indicates Support Levels
Light Blue is a Pivot Point – Black represents the price when the report was produced
XAU/USD Intraday: Break Resistance level
Our pivot point is 1769.96
Preferable Price Action: Further upside to 1789.99 and 1800.31.
Alternative Price Action: If the price gives an downside breakout of a pivot, then the price extends to 1749.81 and 1739.73.
Comment: MACD in positive territory and price above its 20MA & 55MA.
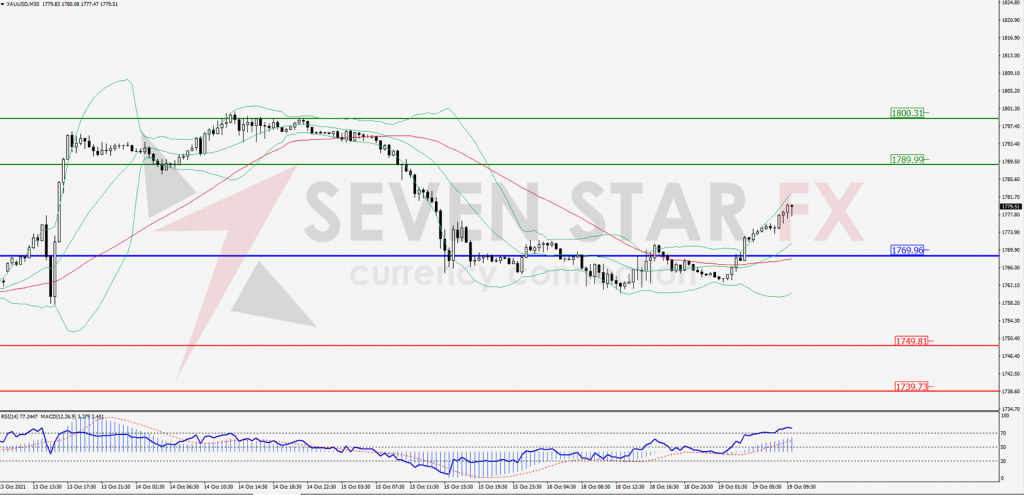
Green Lines Indicate Resistance Levels – Red Lines Indicates Support Levels
Light Blue is a Pivot Point – Black represents the price when the report was produced
Dow Jones Intraday: Trend on the upside
Our pivot point is 35,015.00
Preferable Price Action: Take long positions above pivot with targets at 35,484.91 & 35,680.54.
Alternative Price Action: Below 35,015.00 looks for further downside to 34,568.38 & 34,362.02.
Comment: Price above its 55MA & 20MA and RSI above 50 levels.
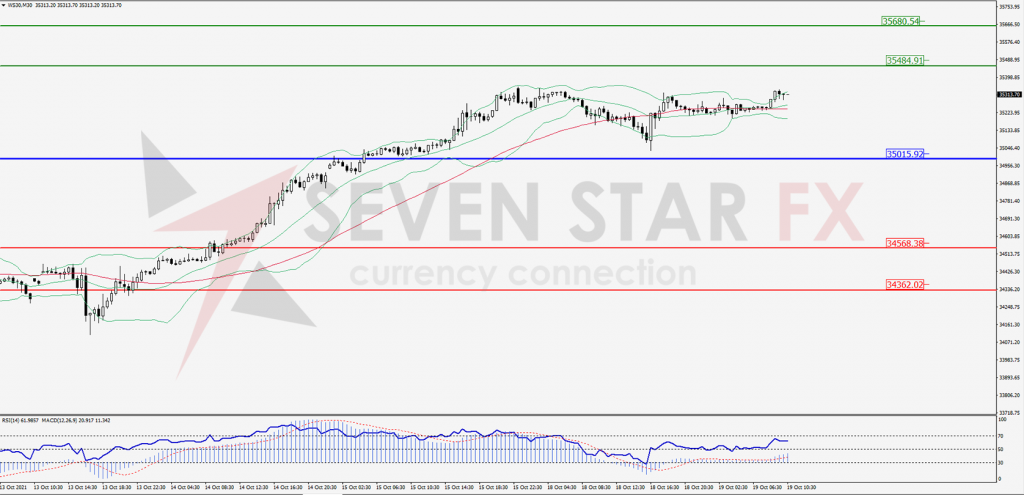
Green Lines Indicate Resistance Levels – Red Lines Indicates Support Levels
Light Blue is a Pivot Point – Black represents the price when the report was produced