Market Wrap: Stocks, Bonds, Commodities
US stocks ended sharply lower on Wednesday, with the S&P 500 and Nasdaq falling more than 1 percent each, as Treasury yields rose again and investors assessed the latest batch of quarterly corporate results and forecasts.
The Dow Jones Industrial Average fell 332.57 points to 33,665.08, the S&P 500 lose 1.34% to 4,314.60 and the Nasdaq Composite subtract 219.45 points to 13,314.30.
MSCI’s index of Asia-Pacific stocks outside Japan is decline 1.47% to 592.44 levels. The Australian index was lower by 1.36% to 6,981.60. Japanese Nikkei Index drop 1.86% today.
European stocks were positive on Thursday, with the Stoxx Europe 50 Index fell 0.40% to 4,089.25, Germany’s DAX drop 0.38% to 15,037.35, and France’s CAC decline 0.82% to 7,515.15 and U.K.’s FTSE 100 subtract 0.99% to 7,512.69.
Benchmark 10-year U.S. Treasury fell as demand for safe assets ascend again, today 10-year bond yields positive 1.43% to 4.9740.
Oil prices fell on Thursday, reversing gains in the previous session, after OPEC showed no signs of supporting Iran’s call for an oil embargo on Israel and as the United States plans to ease Venezuela sanctions to allow more oil to flow globally.
Spot Brent crude oil drop 1.66% to $90.00 per barrel. US West Texas Intermediate crude is down 1.52% to $85.92 a barrel.
The yellow metal gold is decline 0.34% to 1,961.50 dollars per ounce.
Market Wrap: Forex
The dollar held firm against major currencies on Thursday, and gained on more volatile ones, underpinned as the U.S. 10 year yield neared the 5% level and ahead of closely-watched remarks by Federal Reserve chair Jerome Powell.
Today, the U.S. dollar index measures the Greenback against a trade-weighted basket of six major currencies, which surged 0.06% to 106.410.
The Euro US Dollar (EUR/USD) is a widely traded pair that is up 0.05% today. This left the pair trading around $1.05400.
The Japanese yen was negative against the U.S. dollar on Thursday. Today USD/JPY is slipped 0.06% to the 149.840 level.
Another commodity-related currency negative against the U.S dollar, AUD/USD fell 0.56% to 0.63000, and NZD/USD slipped 0.61% to 0.58200 level.
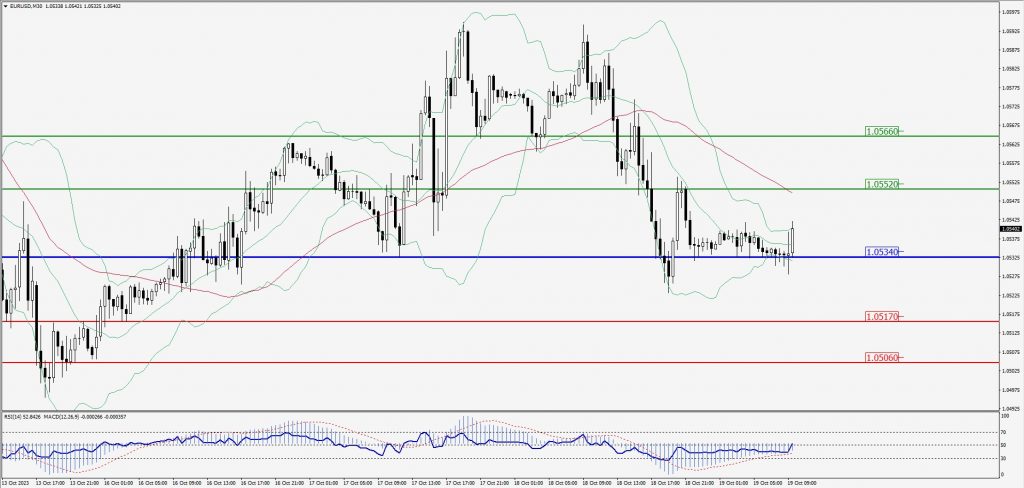
EUR/USD Intraday: In a consolidation zone
Our pivot point is at 1.05340
Preferable Price Action: Take buy positions above pivot level with targets at 1.05520 & 1.05660 in extension.
Alternative Price Action: Below pivot looks for a further downside to 1.05170 & 1.05060.
Comment: RSI is at 50 levels and Pairs above 20MA.
Green Lines Indicate Resistance Levels – Red Lines Indicate Support Levels
Light Blue is a Pivot Point – Black represents the price when the report was produced
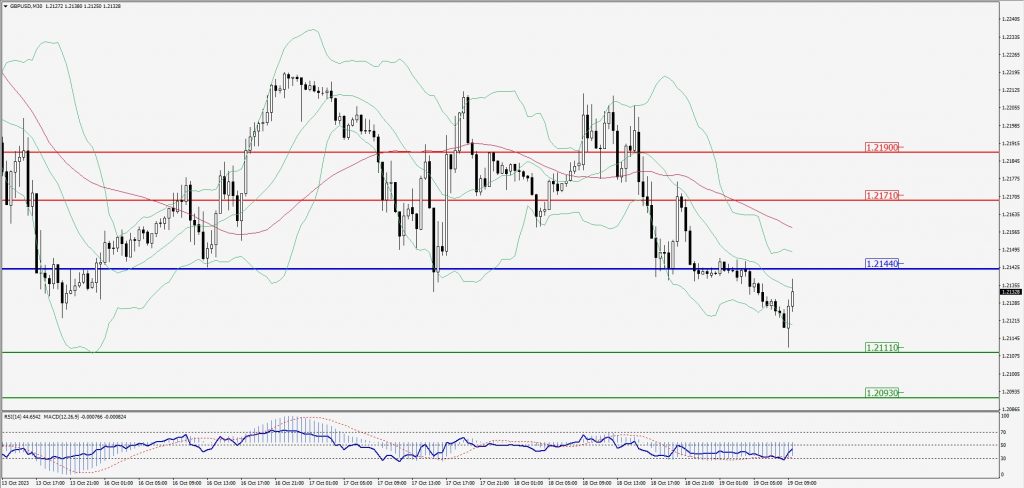
GBP/USD Intraday: Trend on the downside
Our pivot point is at 1.21440
Preferable Price Action: Sell positions below pivot with targets at 1.21110 & 1.20930 in extension.
Alternative Price Action: The price above pivot would call for further upside to 1.21710 & 1.21900.
Comment: RSI is below 50 levels and Pairs below 55MA.
Green Lines Indicate Resistance Levels – Red Lines Indicate Support Levels
Light Blue is a Pivot Point – Black represents the price when the report was produced
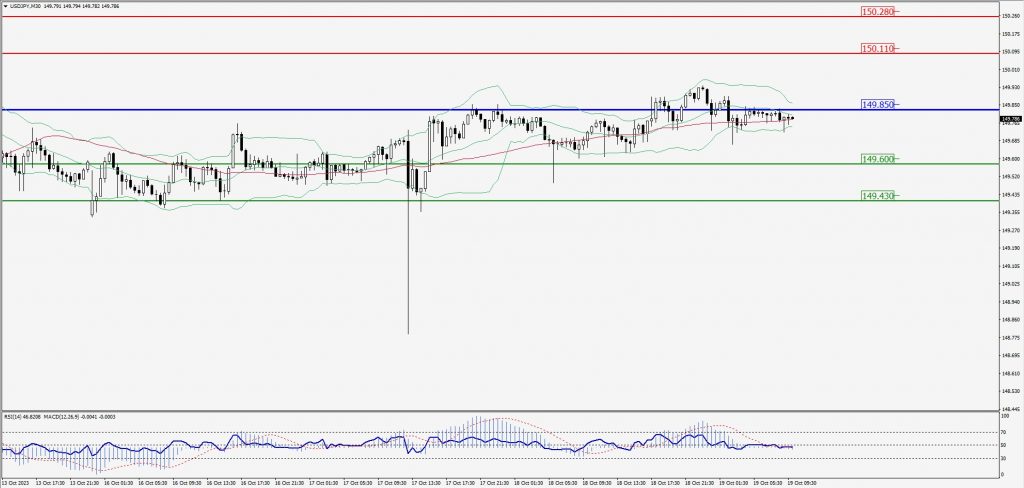
USD/JPY Intraday: Resistance level at 149.850
Our pivot point is at 149.850
Preferable Price Action: Sell position below pivot with the target at 149.600 and 149.430 in extension.
Alternative Price Action: The upside breakout of the pivot would call for 150.110 and 150.280.
Comment: MACD is below 50 level and Pairs below 20MA.
Green Lines Indicate Resistance Levels – Red Lines Indicate Support Levels
Light Blue is a Pivot Point – Black represents the price when the report was produced
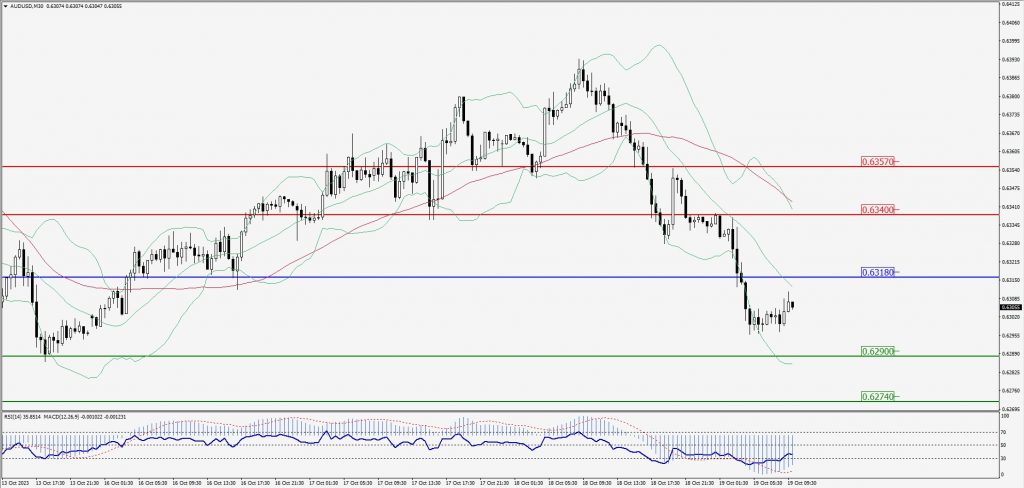
AUD/USD Intraday: Trend on the downside
Our pivot point is at 0.63180
Preferable Price Action: Sell positions below pivot with targets at 0.62900 & 0.62740 in extension.
Alternative Price Action: Above pivot looks for a further upside with 0.63400 & 0.63570 as targets.
Comment: RSI is below 50 levels and Pairs below its 20MA & 55MA.
Green Lines Indicate Resistance Levels – Red Lines Indicate Support Levels
Light Blue is a Pivot Point – Black represents the price when the report was produced
CRUDEOIL Intraday: Resistance level at 87.27
Our pivot point is at 87.27
Preferable Price Action: Below pivot sell oil with 86.38 & 85.80 as targets.
Alternative Price Action: Buy crude above pivot with targets at 88.08 and 88.66 in extension.
Comment: MACD is negative territory and Pairs below 55MA.
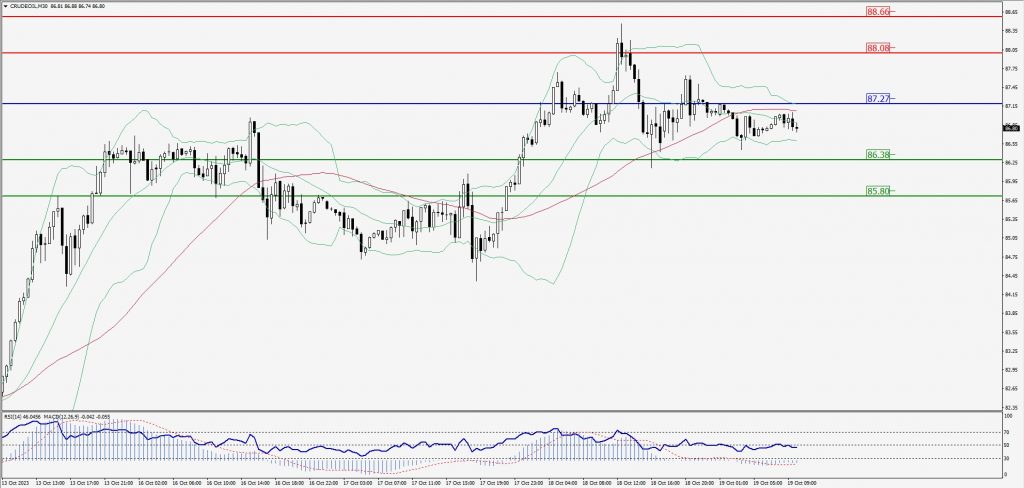
Green Lines Indicate Resistance Levels – Red Lines Indicate Support Levels
Light Blue is a Pivot Point – Black represents the price when the report was produced
XAU/USD Intraday: In a consolidation zone
Our pivot point is 1947.10
Preferable Price Action: Further upside to 1962.30 and 1975.20.
Alternative Price Action: If the price gives a downside breakout of a pivot, then the price extends to 1934.00 and 1923.90.
Comment: MACD is above 50 level and Pairs above 55MA.

Green Lines Indicate Resistance Levels – Red Lines Indicate Support Levels
Light Blue is a Pivot Point – Black represents the price when the report was produced
Dow Jones Intraday: Trend on the downside
Our pivot point is 33,683.00
Preferable Price Action: Take sell positions below the pivot with targets at 33,556.00 & 33,479.00.
Alternative Price Action: Above 33,974.00 looks for further upside to 33,785.00 & 33,868.00.
Comment: RSI is below 50 levels and Pairs below its 20MA & 55MA.
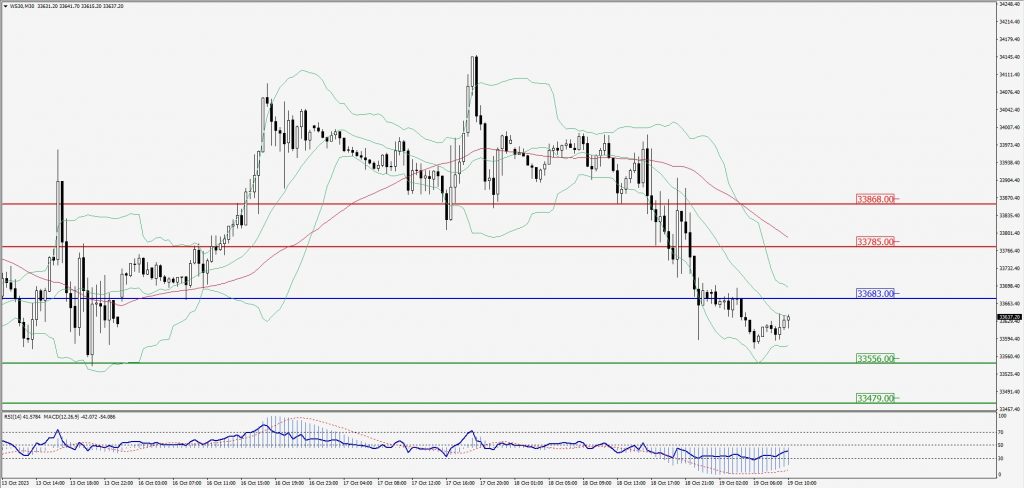
Green Lines Indicate Resistance Levels – Red Lines Indicate Support Levels
Light Blue is a Pivot Point – Black represents the price when the report was produced