Market Wrap: Stocks, Bonds, Commodities
Stocks slipped on Friday as Wall Street closed out a huge week in which investors received a pause on rate hikes from the Federal Reserve, plus encouraging inflation data.
The Dow Jones Industrial Average fell 108.94 points to 34,299.12, the S&P 500 lose 0.37% to 4,409.59 and the Nasdaq Composite subtract 93.25 points to 13,689.57.
MSCI’s index of Asia-Pacific stocks outside Japan is decline 0.79% to 654.10 levels. The Australian index was higher by 0.60% to 7,294.90. Japanese Nikkei Index decline 1.00% today.
European stocks were negative on Monday, with the Stoxx Europe 50 Index fell 0.30% to 4,381.85, Germany’s DAX decline 0.50% to 16,275.63, and France’s CAC drop 0.47% to 7,622.26 and U.K.’s FTSE 100 subtract 0.27% to 7,621.10.
Benchmark 10-year U.S. Treasury fell as demand for safe assets ascend again, today 10-year bond yields positive 0.75% to 3.8000.
Oil rose on Friday and posted a weekly gain, as higher Chinese demand and OPEC+ supply cuts lifted prices, despite expected weakness in the global economy and the prospect for further interest rate hikes.
Spot Brent crude oil drop 0.25% to $76.44 per barrel. US West Texas Intermediate crude is down 0.21% to $71.78 a barrel.
The yellow metal gold is decline 0.20% to 1,967.40 dollars per ounce.
Market Wrap: Forex
The U.S. dollar edged higher in thin holiday-affected trade Monday, as traders digested the impact of last week’s central bank decisions, with a speech by Fed Chair Jerome Powell looming large.
Today, the U.S. dollar index measures the Greenback against a trade-weighted basket of six major currencies, which surged 0.15% to 101.980.
The Euro US Dollar (EUR/USD) is a widely traded pair that is down 0.14% today. This left the pair trading around $1.09270.
The Japanese yen was negative against the U.S. dollar on Monday. Today USD/JPY is surged 0.10% to the 141.890 level.
Another commodity-related currency negative against the U.S dollar, AUD/USD fell 0.17% to 0.68650, and NZD/USD slipped 0.16% to 0.62210 level.
EUR/USD Intraday: Resistance level at 1.09480
Our pivot point is at 1.09480
Preferable Price Action: Take sell positions below pivot level with targets at 1.09050 & 1.08770 in extension.
Alternative Price Action: Above pivot looks for a further upside to 1.09890 & 1.10160.
Comment: RSI is below 50 levels and Pairs below its 20MA & 55MA.
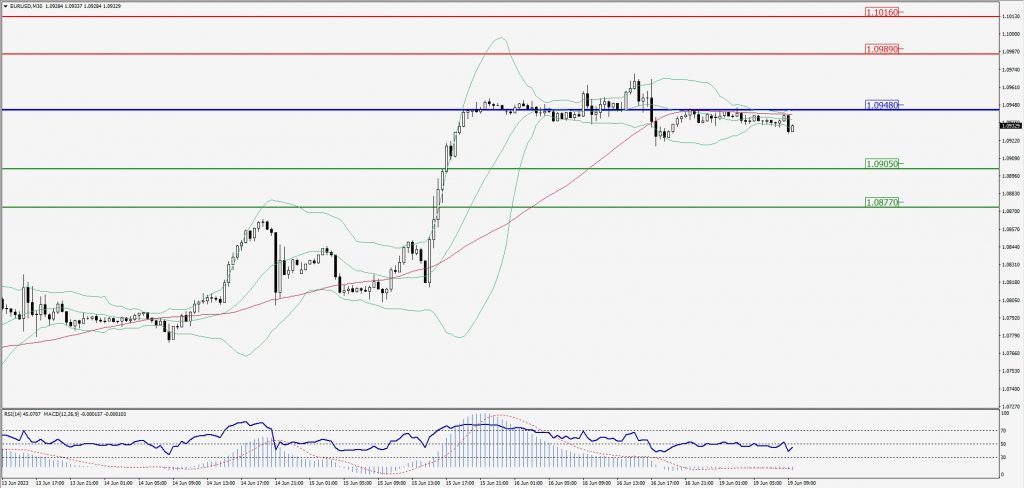
Green Lines Indicate Resistance Levels – Red Lines Indicate Support Levels
Light Blue is a Pivot Point – Black represents the price when the report was produced
GBP/USD Intraday: In a consolidation zone
Our pivot point is at 1.28380
Preferable Price Action: Sell positions below pivot with targets at 1.27660 & 1.27240 in extension.
Alternative Price Action: The price above pivot would call for further upside to 1.29040 & 1.29510.
Comment: RSI is at 50 levels and Pairs below 20MA.
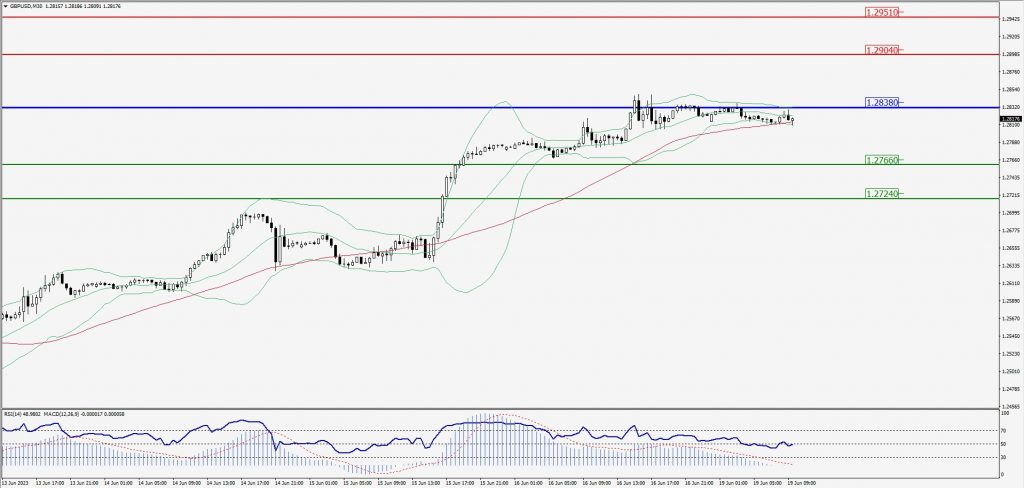
Green Lines Indicate Resistance Levels – Red Lines Indicate Support Levels
Light Blue is a Pivot Point – Black represents the price when the report was produced
USD/JPY Intraday: In a consolidation zone
Our pivot point is at 141.540
Preferable Price Action: Buy position above pivot with the target at 142.140 and 142.520 in extension.
Alternative Price Action: The downside breakout of the pivot would call for 141.050 and 140.670.
Comment: MACD is above 50 level and Pairs above 55MA.
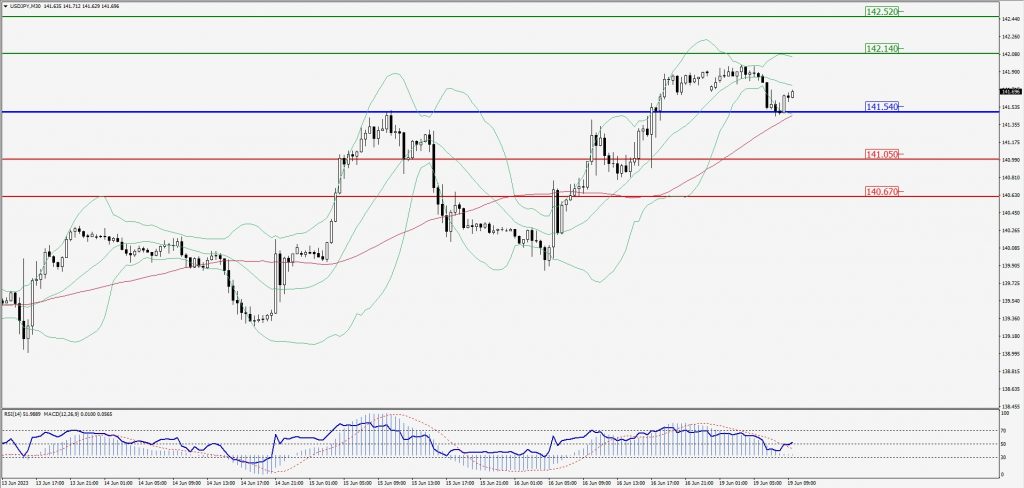
Green Lines Indicate Resistance Levels – Red Lines Indicate Support Levels
Light Blue is a Pivot Point – Black represents the price when the report was produced
AUD/USD Intraday: Trend on the downside
Our pivot point is at 0.68680
Preferable Price Action: Sell positions below pivot with targets at 0.68330 & 0.68100 in extension.
Alternative Price Action: Above pivot looks for a further upside with 0.69050 & 0.69260 as targets.
Comment: RSI is below 50 levels and Pairs below its 20MA & 55MA.
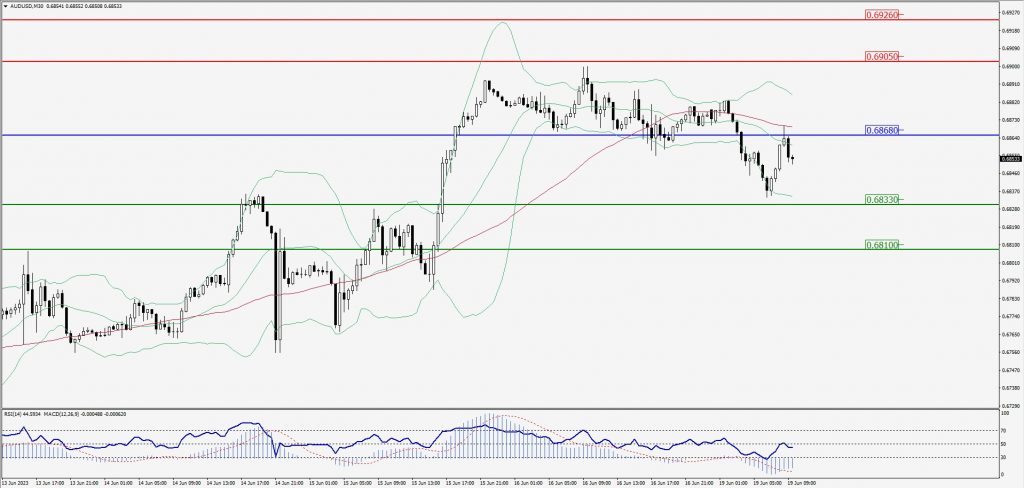
Green Lines Indicate Resistance Levels – Red Lines Indicate Support Levels
Light Blue is a Pivot Point – Black represents the price when the report was produced
CRUDEOIL Intraday: Support level at 70.93
Our pivot point is at 70.93
Preferable Price Action: Above pivot buy oil with 72.01 & 72.84 as targets.
Alternative Price Action: Sell crude below pivot with targets at 69.99 and 69.34 in extension.
Comment: MACD is positive territory and Pairs above 55MA.
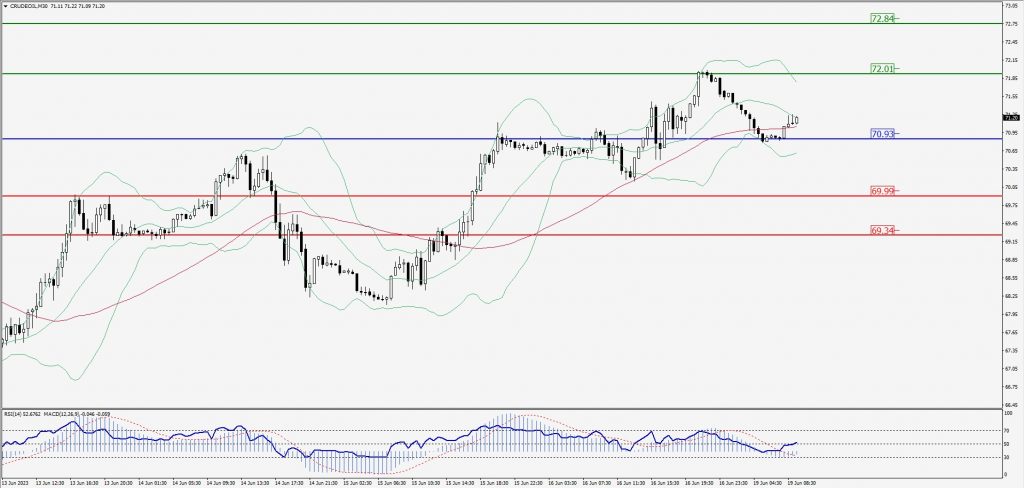
Green Lines Indicate Resistance Levels – Red Lines Indicate Support Levels
Light Blue is a Pivot Point – Black represents the price when the report was produced
XAU/USD Intraday: Trend on the downside
Our pivot point is 1956.50
Preferable Price Action: Further downside to 1949.60 and 1944.50
Alternative Price Action: If the price gives a downside breakout of a pivot, then the price extends to 1965.80 and 1972.10.
Comment: MACD is below 50 level and Pairs below its 20MA & 55MA.
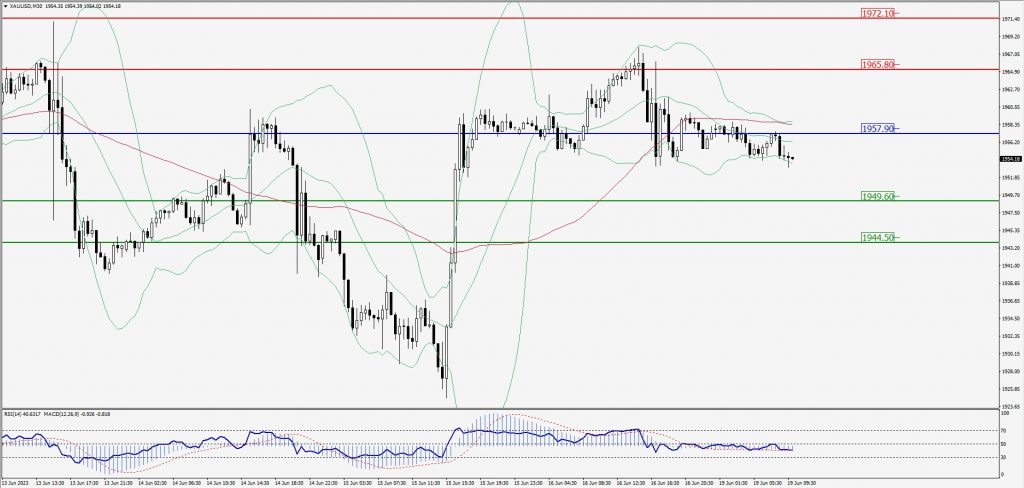
Green Lines Indicate Resistance Levels – Red Lines Indicate Support Levels
Light Blue is a Pivot Point – Black represents the price when the report was produced
Dow Jones Intraday: Trend on the downside
Our pivot point is 34,341.00
Preferable Price Action: Take sell positions below the pivot with targets at 34,137.00 & 34,029.00.
Alternative Price Action: Above 34,341.00 looks for further upside to 34,493.00 & 34,611.00.
Comment: RSI is below 50 levels and Pairs below 55MA.
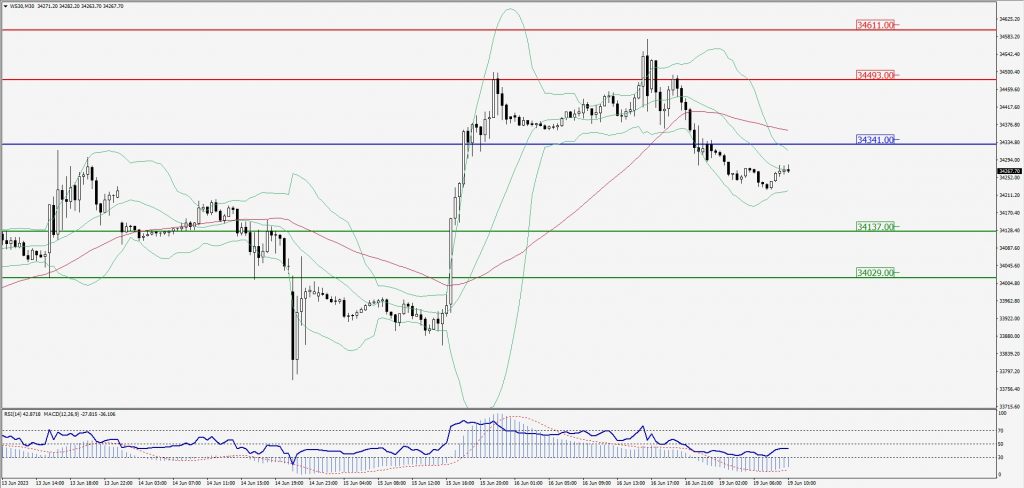
Green Lines Indicate Resistance Levels – Red Lines Indicate Support Levels
Light Blue is a Pivot Point – Black represents the price when the report was produced