Market Wrap: Stocks, Bonds, Commodities
U.S. stocks closed with sharp gains on Tuesday as more companies joined big banks in reporting earnings that beat forecasts, offering respite to investors worried about higher inflation and a tightening Fed denting the corporate bottomline.
The Dow Jones Industrial Average rose 754.44 points to 31,827.05, the S&P 500 gain 105.84 points to 3,936.69 and the Nasdaq Composite add 353.10 points to 11,713.15.
MSCI’s index of Asia-Pacific stocks outside Japan is ascend 0.90% to 644.26 levels. Australian index higher 1.65% to 6,759.20. Japanese Nikkei Index ascend 2.67% to 27,680.26.
European stocks were positive on Wednesday, with the Stoxx Europe 50 Index fell 0.09% to 3,584.95, Germany’s DAX advance 0.15% to 13,327.77, and France’s CAC ascend 0.20% to 6,214.20, and U.K.’s FTSE 100 surge 0.33% to 7,326.35.
Benchmark 10-year U.S. Treasury fell as demand for safe assets ascend again, today 10-year bond yields a negative 1.17% to 2.9840.
Oil prices fell slightly in early Asian trade on Wednesday, pressured by global central bank efforts to tame inflation and ahead of expected builds in U.S. crude inventories as product demand weakens.
Spot Brent crude oil subtract 1.11% to $106.20 per barrel. US West Texas Intermediate crude is down 1.20% to $99.52 a barrel.
The yellow metal gold is decline 0.31% to 1,705.45 dollars per ounce.
Market Wrap: Forex
The U.S. dollar edged lower in early European trade Wednesday, with the euro seeing some demand ahead of this week’s important European Central Bank meeting.
Today, the U.S. dollar index measures the Greenback against a trade-weighted basket of six major currencies, which is fell 0.04% to 106.485.
The Euro US Dollar (EUR/USD) is a widely traded pair that is up 0.14% today. This left the pair trading around $1.02380.
The Japanese yen was positive against the U.S. dollar on Wednesday as the stock up. Today USD/JPY is ascend 0.03% to 138.210 level.
Another commodity-related currency positive against the U.S dollar, AUD/USD gain 0.20% to 0.69090, and NZD/USD up 0.27 to 0.62460 level.
EUR/USD Intraday: Support level at 1.02340
Our pivot point is at 1.02340
Preferable Price Action: Take buy positions above pivot level with targets at 1.03430 & 1.04130 in extension.
Alternative Price Action: Below pivot looks for a further downside to 1.01410 & 1.00770.
Comment: RSI above 50 levels and Pair above 55MA.
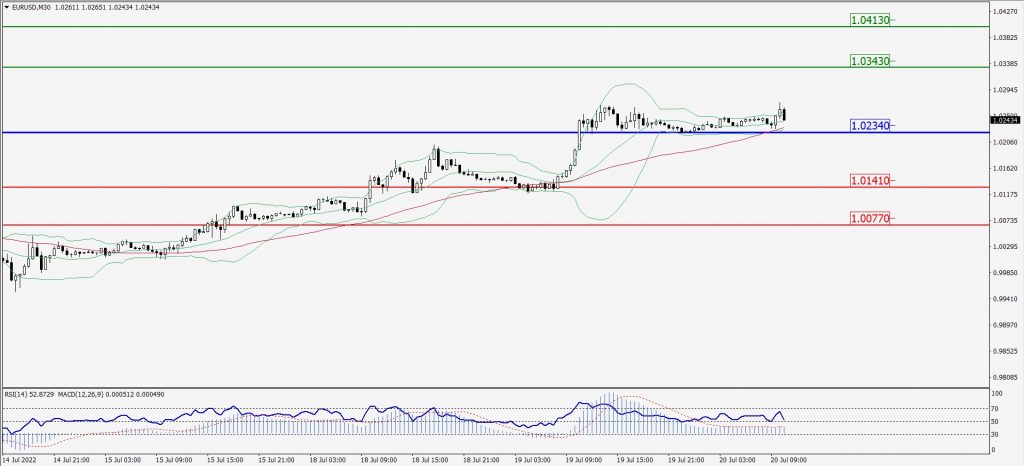
Green Lines Indicate Resistance Levels – Red Lines Indicate Support Levels
Light Blue is a Pivot Point – Black represents the price when the report was produced
GBP/USD Intraday: Trend on the downside
Our pivot point is at 1.20250
Preferable Price Action: Sell positions below pivot with targets at 1.19620 & 1.19170 in extension.
Alternative Price Action: The price above pivot would call for further upside to 1.20860 & 1.21300.
Comment: RSI below 50 levels and pair below 20MA.
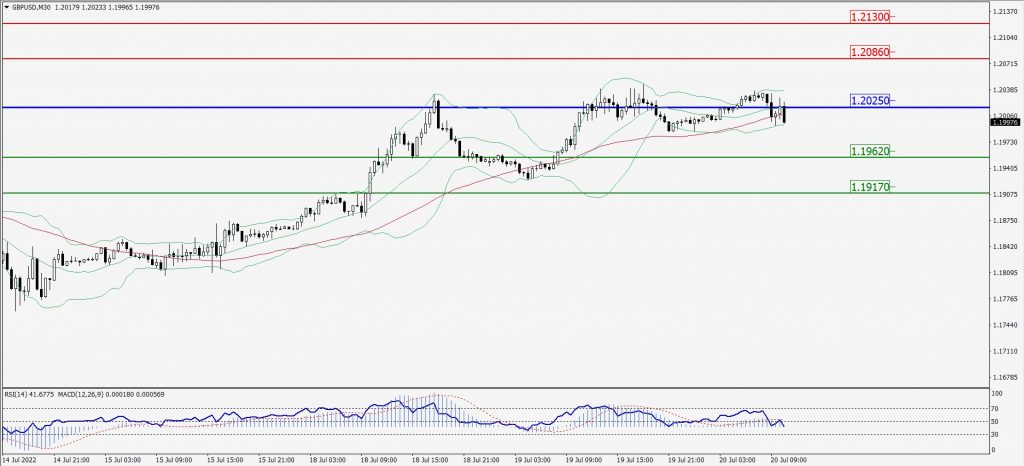
Green Lines Indicate Resistance Levels – Red Lines Indicate Support Levels
Light Blue is a Pivot Point – Black represents the price when the report was produced
USD/JPY Intraday: Trend on the upside
Our pivot point is at 138.040
Preferable Price Action: Buy position above pivot with the target at 138.740 and 139.280 in extension.
Alternative Price Action: The downside breakout of the pivot would call for 137.310 and 136.720.
Comment: MACD is positive territory and Pair above 55MA.
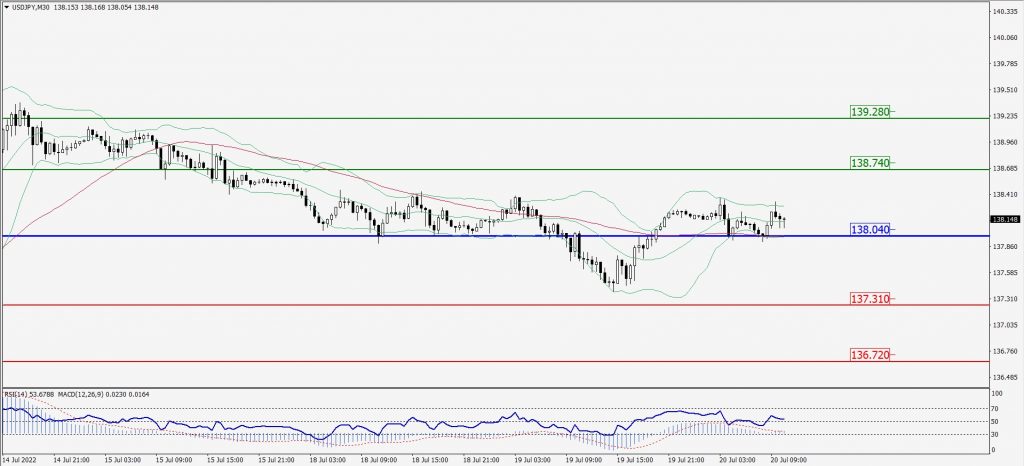
Green Lines Indicate Resistance Levels – Red Lines Indicate Support Levels
Light Blue is a Pivot Point – Black represents the price when the report was produced
AUD/USD Intraday: In a consolidation zone
Our pivot point is at 0.69360
Preferable Price Action: Sell Positions below pivot with targets at 0.68500 & 0.67940 in extension.
Alternative Price Action: Above pivot looks for a further upside with 0.70190 & 0.70770 as targets.
Comment: RSI at 50 levels.
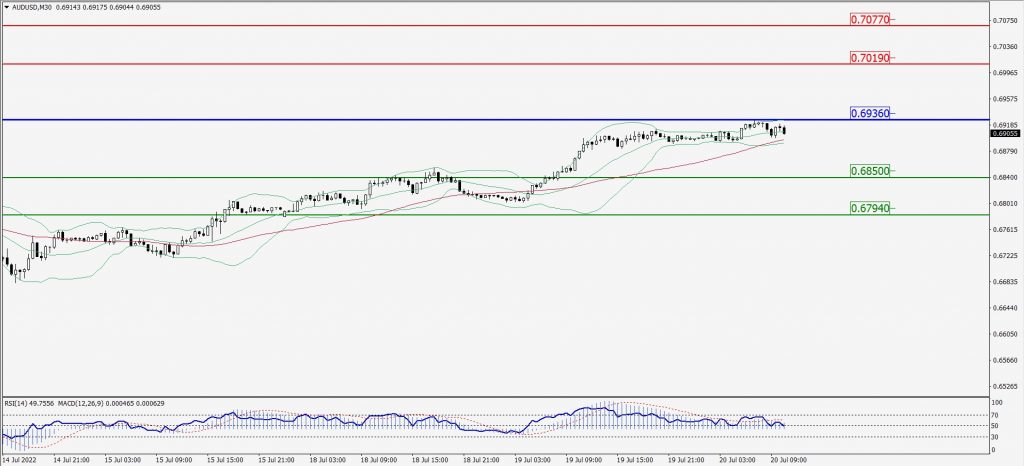
Green Lines Indicate Resistance Levels – Red Lines Indicate Support Levels
Light Blue is a Pivot Point – Black represents the price when the report was produced
CRUDEOIL Intraday: Trend on the downside
Our pivot point is at 99.71
Preferable Price Action: Below pivots sell oil with 96.49 & 94.31 as targets.
Alternative Price Action: Buy crude above pivot with targets at 102.61 and 104.85 in extension.
Comment: MACD is in the negative territory and Pairs below its 20MA & 55MA.
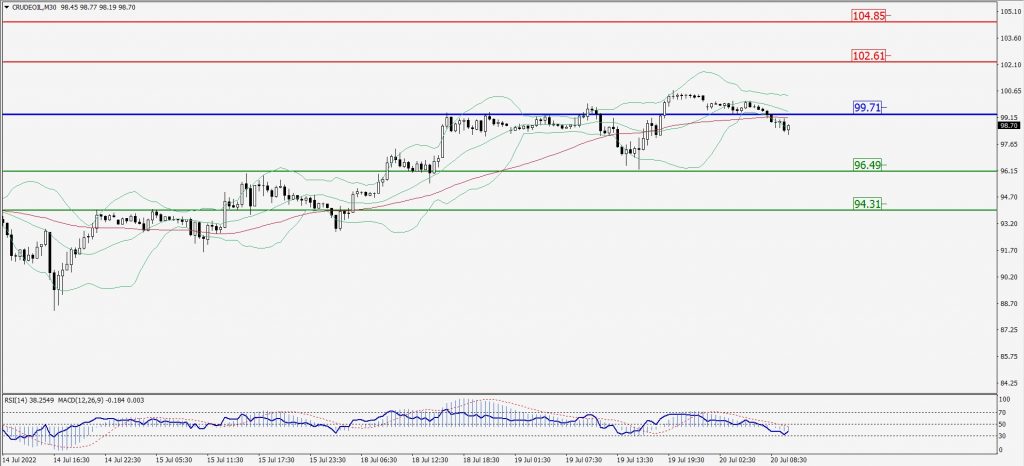
Green Lines Indicate Resistance Levels – Red Lines Indicate Support Levels
Light Blue is a Pivot Point – Black represents the price when the report was produced
XAU/USD Intraday: Major resistance level at 1714.80
Our pivot point is 1714.80
Preferable Price Action: Further downside to 1697.20 and 1685.40
Alternative Price Action: If the price gives an upside breakout of a pivot, then the price extends to 1729.80 and 1740.20.
Comment: MACD is negative territory and Pairs below its 20MA & 55MA.
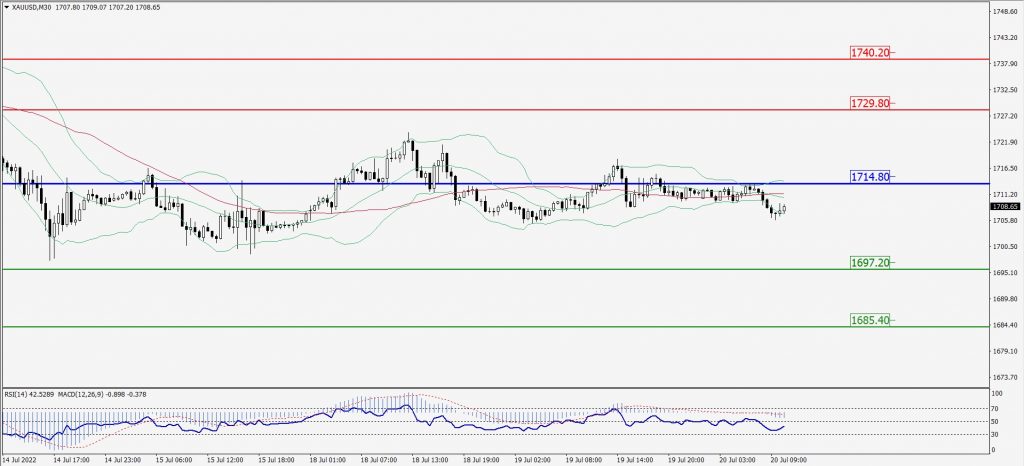
Green Lines Indicate Resistance Levels – Red Lines Indicate Support Levels
Light Blue is a Pivot Point – Black represents the price when the report was produced
Dow Jones Intraday: Trend on the upside
Our pivot point is 31,759.00
Preferable Price Action: Take buy positions above pivot with targets at 32,407.00 & 32,855.00.
Alternative Price Action: Below 31,759.00 looks for further downside to 31,197.00 & 30,782.00.
Comment: RSI above 50 levels and Pair above 55MA.
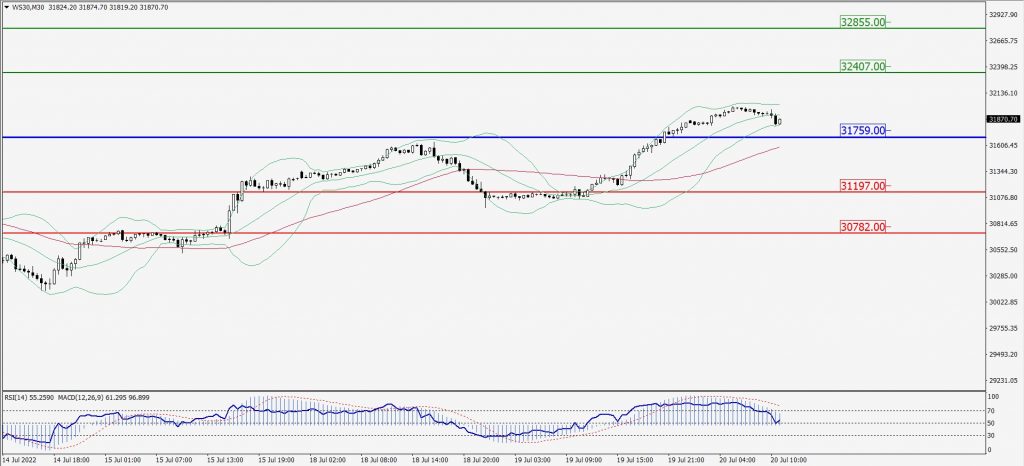
Green Lines Indicate Resistance Levels – Red Lines Indicate Support Levels
Light Blue is a Pivot Point – Black represents the price when the report was produced