Market Wrap: Stocks, Bonds, Commodities
US stocks ended higher on Wednesday with the tech-heavy Nasdaq booking a 1.6 percent gain on positive earnings signals with a wary eye on inflation and more interest rate hikes by the Fed.
The Dow Jones Industrial Average rose 47.79 points to 31,874.84, the S&P 500 gain 23.21 points to 3,959.90 and the Nasdaq Composite add 184.50 points to 11,897.65.
MSCI’s index of Asia-Pacific stocks outside Japan is drop 0.08% to 643.57 levels. Australian index higher 0.52% to 6,794.30. Japanese Nikkei Index ascend 0.44% to 27,803.00.
European stocks were negative on Thursday, with the Stoxx Europe 50 Index fell 0.52% to 3,567.75, Germany’s DAX decline 0.74% to 13,188.92, and France’s CAC drop 0.37% to 6,161.95, and U.K.’s FTSE 100 slipped 0.41% to 7,235.10.
Benchmark 10-year U.S. Treasury fell as demand for safe assets ascend again, today 10-year bond yields a positive 0.24% to 3.0430.
Oil slipped back below $100 a barrel as investors assessed signs of lackluster US gasoline demand and expanding stockpiles.
Spot Brent crude oil subtract 2.21% to $104.56 per barrel. US West Texas Intermediate crude is down 2.50% to $97.36 a barrel.
The yellow metal gold is decline 0.80% to 1,686.45 dollars per ounce.
Market Wrap: Forex
South Korea’s strenuous attempts to defend a sharply weakening currency have run into an unstoppable home-made force working in the opposite direction: the national pension fund.
Today, the U.S. dollar index measures the Greenback against a trade-weighted basket of six major currencies, which is rose 0.05% to 107.013.
The Euro US Dollar (EUR/USD) is a widely traded pair that is up 0.07% today. This left the pair trading around $1.01850.
The Japanese yen was positive against the U.S. dollar on Thursday as the stock up. Today USD/JPY is ascend 0.22% to 138.500 level.
Another commodity-related currency negative against the U.S dollar, AUD/USD lose 0.25% to 0.68660, and NZD/USD down 0.51 to 0.61950 level.
EUR/USD Intraday: Support level at 1.02080
Our pivot point is at 1.02080
Preferable Price Action: Take buy positions above pivot level with targets at 1.02900 & 1.03500 in extension.
Alternative Price Action: Below pivot looks for a further downside to 1.01410 & 1.00900.
Comment: RSI above 50 levels and Pair above 20MA.
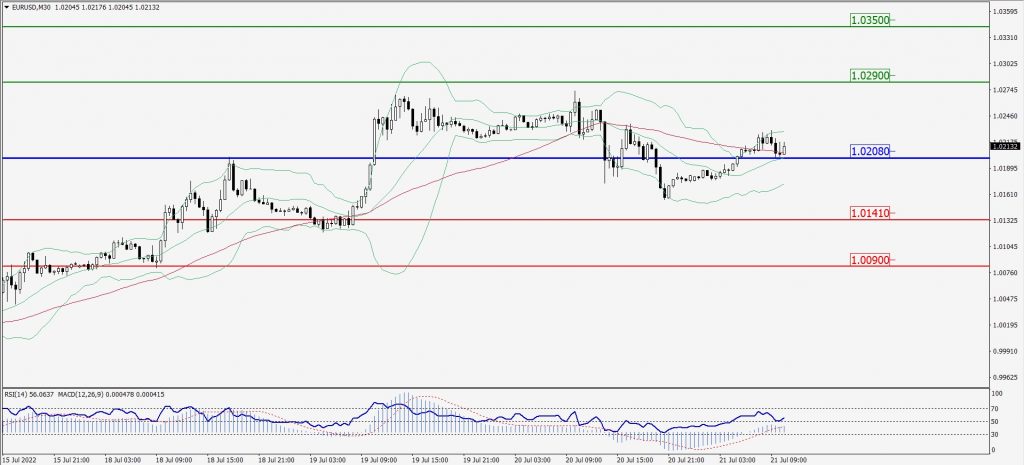
Green Lines Indicate Resistance Levels – Red Lines Indicate Support Levels
Light Blue is a Pivot Point – Black represents the price when the report was produced
GBP/USD Intraday: Trend on the downside
Our pivot point is at 1.19900
Preferable Price Action: Sell positions below pivot with targets at 1.18960 & 1.18380 in extension.
Alternative Price Action: The price above pivot would call for further upside to 1.20680 & 1.21200.
Comment: RSI below 50 levels and pair below its 20MA & 55MA.
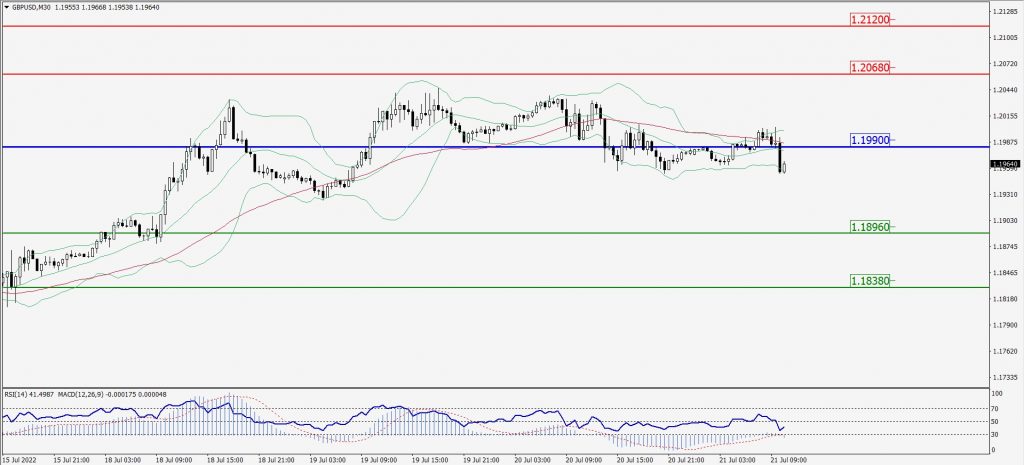
Green Lines Indicate Resistance Levels – Red Lines Indicate Support Levels
Light Blue is a Pivot Point – Black represents the price when the report was produced
USD/JPY Intraday: Trend on the upside
Our pivot point is at 138.430
Preferable Price Action: Buy position above pivot with the target at 139.230 and 139.770 in extension.
Alternative Price Action: The downside breakout of the pivot would call for 137.810 and 137.280.
Comment: MACD is positive territory and Pair above its 20MA & 55MA.
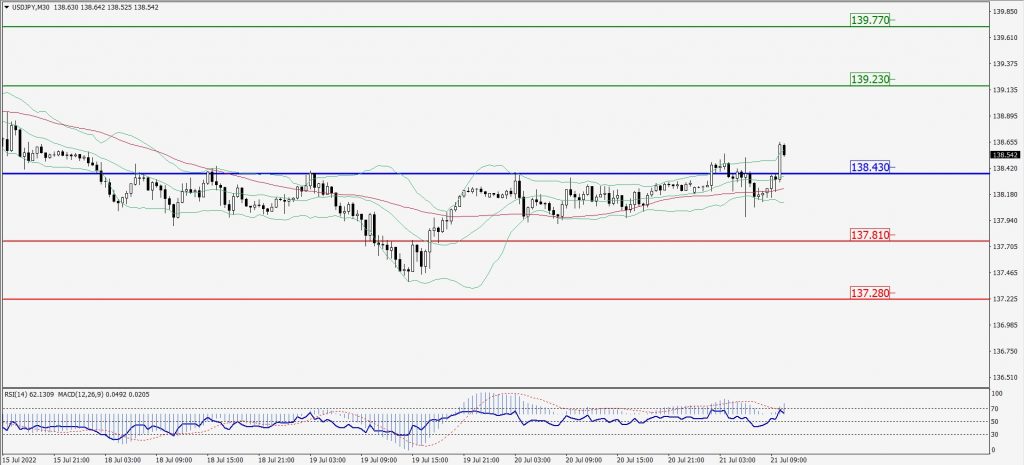
Green Lines Indicate Resistance Levels – Red Lines Indicate Support Levels
Light Blue is a Pivot Point – Black represents the price when the report was produced
AUD/USD Intraday: Resistance level at 0.69030
Our pivot point is at 0.69030
Preferable Price Action: Sell Positions below pivot with targets at 0.68300 & 0.67860 in extension.
Alternative Price Action: Above pivot looks for a further upside with 0.69590 & 0.70000 as targets.
Comment: RSI below 50 levels and Pairs below its 20MA & 55MA.
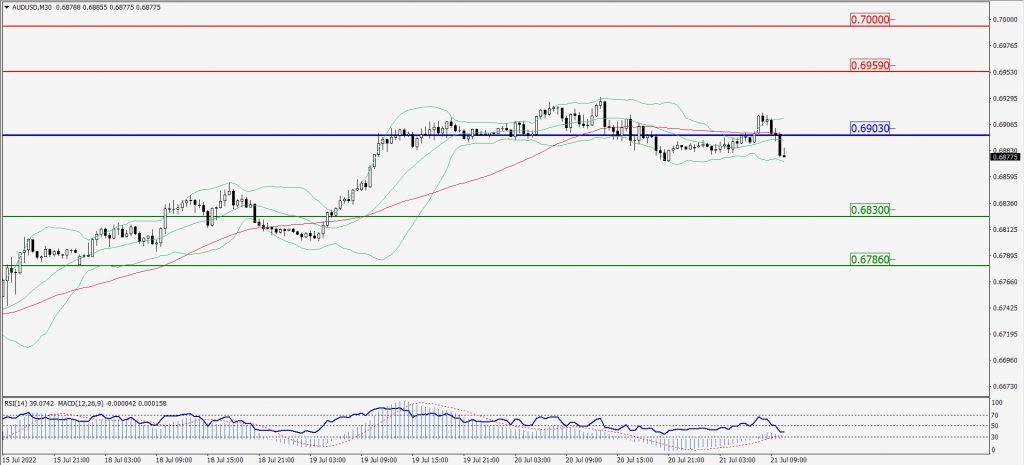
Green Lines Indicate Resistance Levels – Red Lines Indicate Support Levels
Light Blue is a Pivot Point – Black represents the price when the report was produced
CRUDEOIL Intraday: Major resistance level at 99.20
Our pivot point is at 99.20
Preferable Price Action: Below pivots sell oil with 95.40 & 93.10 as targets.
Alternative Price Action: Buy crude above pivot with targets at 102.10 and 104.40 in extension.
Comment: MACD is in the negative territory and Pairs below its 20MA & 55MA.
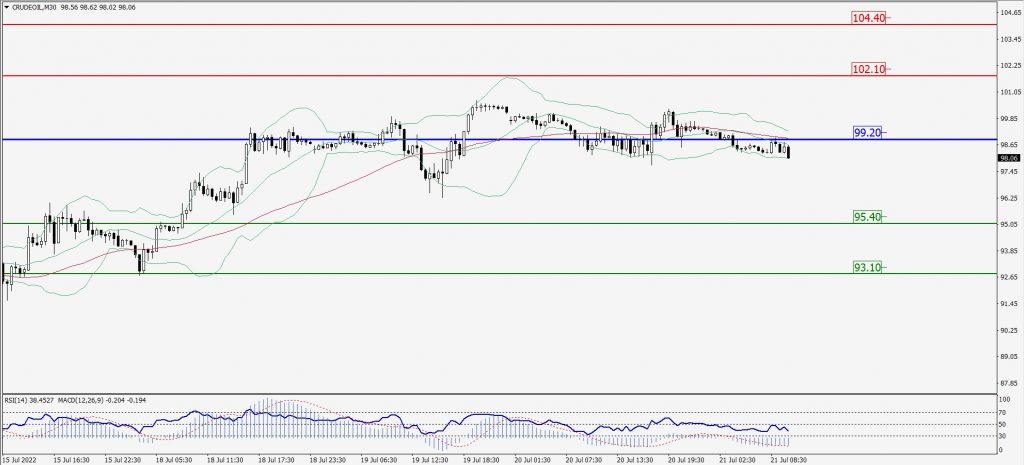
Green Lines Indicate Resistance Levels – Red Lines Indicate Support Levels
Light Blue is a Pivot Point – Black represents the price when the report was produced
XAU/USD Intraday: Trend on the downside
Our pivot point is 1695.50
Preferable Price Action: Further downside to 1675.90 and 1662.60
Alternative Price Action: If the price gives an upside breakout of a pivot, then the price extends to 1713.90 and 1726.00.
Comment: MACD is negative territory and Pairs below its 20MA & 55MA.
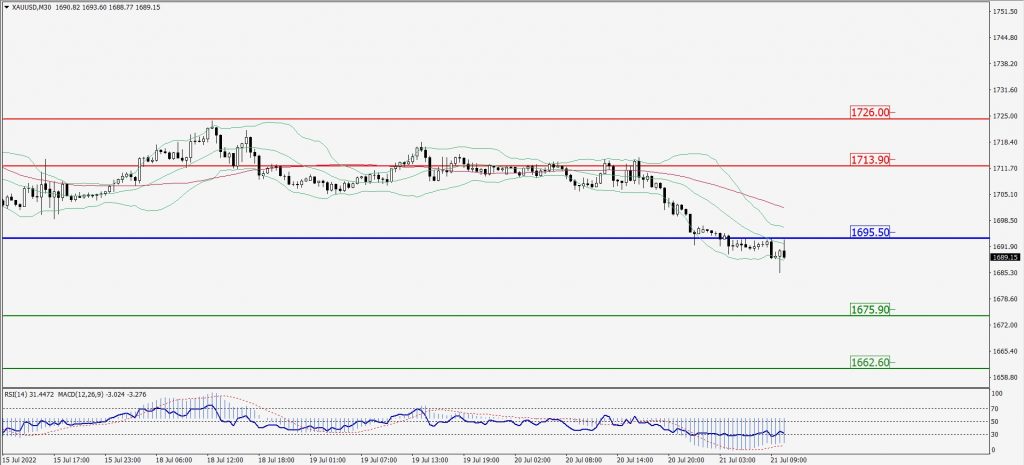
Green Lines Indicate Resistance Levels – Red Lines Indicate Support Levels
Light Blue is a Pivot Point – Black represents the price when the report was produced
Dow Jones Intraday: In a consolidation zone
Our pivot point is 31,975.00
Preferable Price Action: Take sell positions below pivot with targets at 31,557.00 & 31,246.00.
Alternative Price Action: Above 31,975.00 looks for further upside to 32,374.00 & 32,726.00.
Comment: RSI at 50 levels.
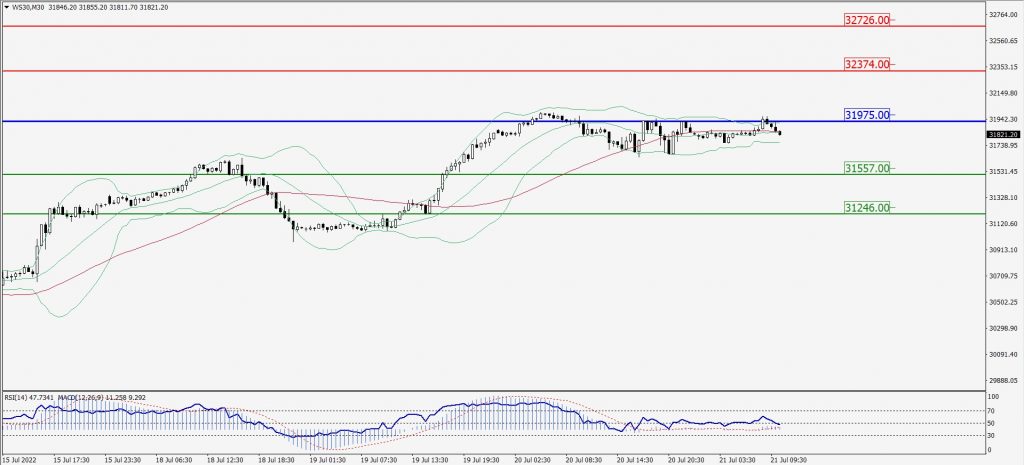
Green Lines Indicate Resistance Levels – Red Lines Indicate Support Levels
Light Blue is a Pivot Point – Black represents the price when the report was produced