Market Wrap: Stocks, Bonds, Commodities
Wall Street ended lower on Monday after bank stocks erased earlier gains and Apple shares fell on a report saying the company plans to slow hiring and spending growth next year.
The Dow Jones Industrial Average fell 215.65 points to 31,072.61, the S&P 500 lose 32.31 points to 3,830.85 and the Nasdaq Composite subtract 92.37 points to 11,360.05.
MSCI’s index of Asia-Pacific stocks outside Japan is drop 0.39% to 638.15 levels. Australian index lower 0.56% to 6,649.60. Japanese Nikkei Index ascend 0.65% to 26,961.68.
European stocks were negative on Tuesday, with the Stoxx Europe 50 Index fell 0.96% to 3,478.15, Germany’s DAX decline 0.84% to 12,855.71, and France’s CAC drop 0.90% to 6,038.74, and U.K.’s FTSE 100 slipped 0.25% to 7,205.00.
Benchmark 10-year U.S. Treasury fell as demand for safe assets ascend again, today 10-year bond yields a positive 1.11% to 2.9930.
Oil prices fell on Tuesday, taking a breather after surging more than $5 a barrel in the previous session as a plunging dollar supported buying interest and on expectations the US Federal Reserve’s interest rate hike may be less than thought.
Spot Brent crude oil add 0.26% to $106.56 per barrel. US West Texas Intermediate crude is up 0.36% to $99.80 a barrel.
The yellow metal gold is decline 0.03% to 1,709.80 dollars per ounce.
Market Wrap: Forex
The U.S. dollar hovered just above a one-week low on Tuesday as markets reduced the odds of a full percentage-point Federal Reserve rate hike this month.
Today, the U.S. dollar index measures the Greenback against a trade-weighted basket of six major currencies, which is fell 0.73% to 106.457.
The Euro US Dollar (EUR/USD) is a widely traded pair that is up 1.05% today. This left the pair trading around $1.02460.
The Japanese yen was positive against the U.S. dollar on Tuesday as the stock up. Today USD/JPY is drop 0.26% to 137.750 level.
Another commodity-related currency positive against the U.S dollar, AUD/USD gain 1.11% to 0.68880, and NZD/USD up 1.10 to 0.62190 level.
EUR/USD Intraday: Trend on the upside
Our pivot point is at 1.01640
Preferable Price Action: Take buy positions above pivot level with targets at 1.02640 & 1.03440 in extension.
Alternative Price Action: Below pivot looks for a further downside to 1.00730 & 1.00020.
Comment: RSI above 50 levels and Pair above its 20MA & 55MA.
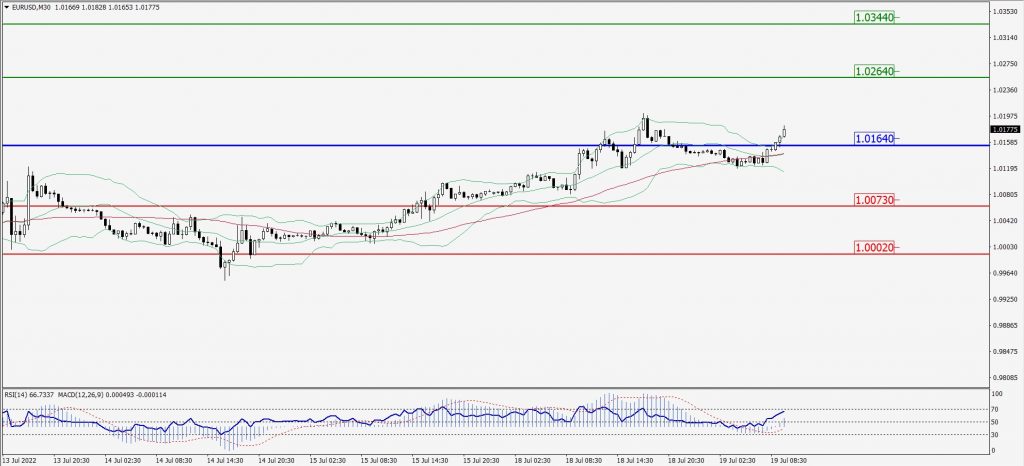
Green Lines Indicate Resistance Levels – Red Lines Indicate Support Levels
Light Blue is a Pivot Point – Black represents the price when the report was produced
GBP/USD Intraday: Trend on the upside
Our pivot point is at 1.19780
Preferable Price Action: Buy positions above pivot with targets at 1.20590 & 1.21120 in extension.
Alternative Price Action: The price below pivot would call for further downside to 1.19120 & 1.18600.
Comment: RSI above 50 levels and pair above its 20MA & 55MA.
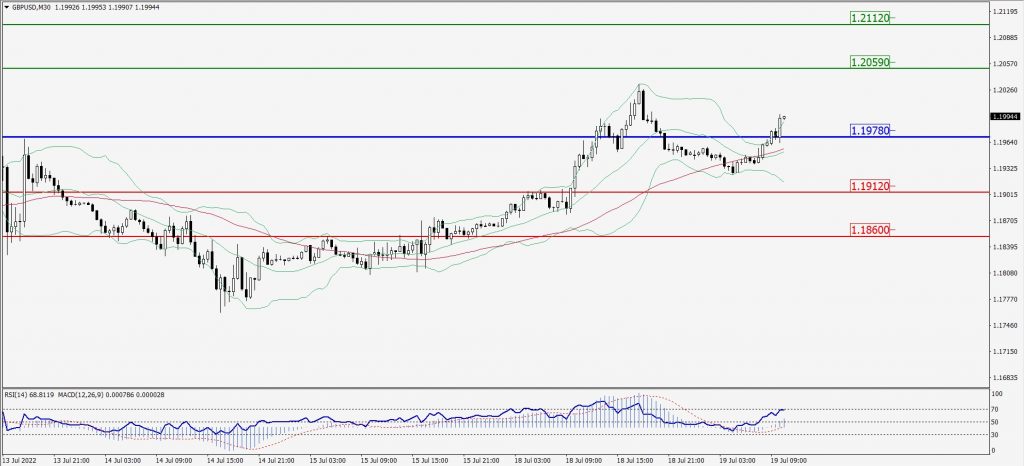
Green Lines Indicate Resistance Levels – Red Lines Indicate Support Levels
Light Blue is a Pivot Point – Black represents the price when the report was produced
USD/JPY Intraday: Trend on the downside
Our pivot point is at 138.180
Preferable Price Action: Sell position below pivot with the target at 137.330 and 136.720 in extension.
Alternative Price Action: The upside breakout of the pivot would call for 139.000 and 139.530.
Comment: MACD is negative territory and Pair below its 20MA & 55MA.
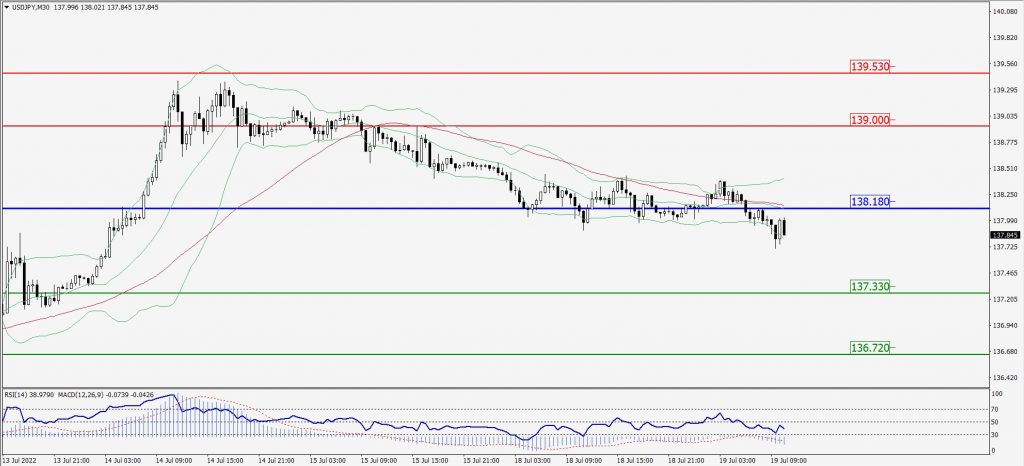
Green Lines Indicate Resistance Levels – Red Lines Indicate Support Levels
Light Blue is a Pivot Point – Black represents the price when the report was produced
AUD/USD Intraday: Trend on the upside
Our pivot point is at 0.68530
Preferable Price Action: Buy Positions above pivot with targets at 0.69560 & 0.70250 in extension.
Alternative Price Action: Below pivot looks for a further downside with 0.67670 & 0.67090 as targets.
Comment: RSI above 50 levels and Pairs above ita 20MA & 55MA.
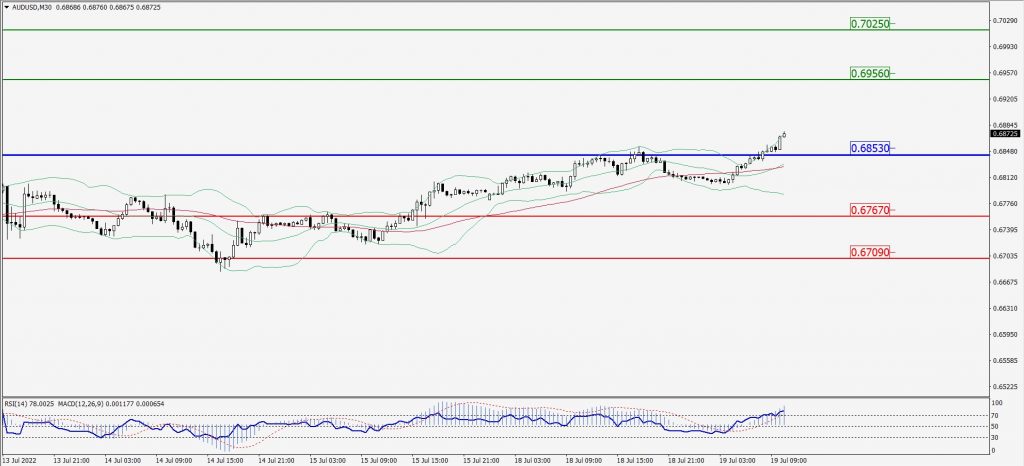
Green Lines Indicate Resistance Levels – Red Lines Indicate Support Levels
Light Blue is a Pivot Point – Black represents the price when the report was produced
CRUDEOIL Intraday: Support level at 99.06
Our pivot point is at 99.06
Preferable Price Action: Above pivots buy oil with 103.38 & 106.76 as targets.
Alternative Price Action: Sell crude below pivot with targets at 95.46 and 92.61 in extension.
Comment: MACD is in the positive territory and Pairs above its 20MA & 55MA.
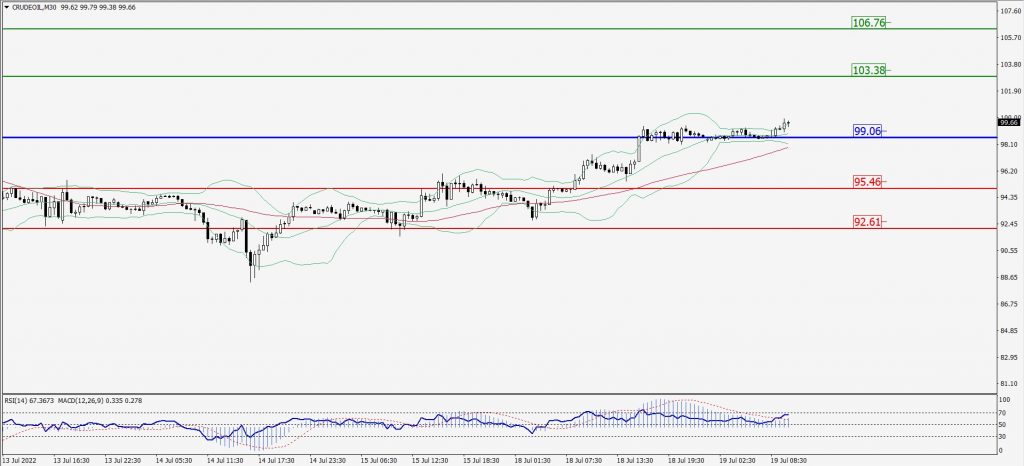
Green Lines Indicate Resistance Levels – Red Lines Indicate Support Levels
Light Blue is a Pivot Point – Black represents the price when the report was produced
XAU/USD Intraday: In a consolidation zone
Our pivot point is 1714.80
Preferable Price Action: Further downside to 1697.20 and 1685.40
Alternative Price Action: If the price gives an upside breakout of a pivot, then the price extends to 1729.90 and 1740.20.
Comment: MACD is flat territory and Pairs below 55MA.
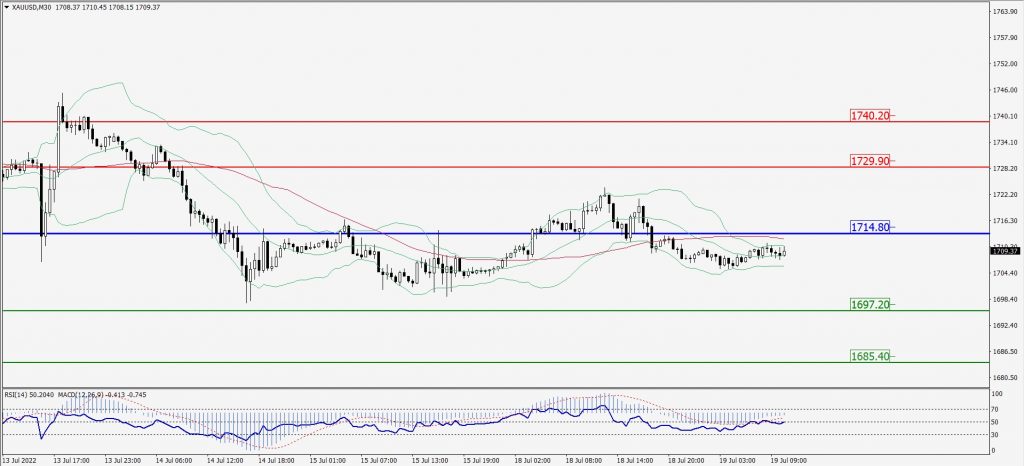
Green Lines Indicate Resistance Levels – Red Lines Indicate Support Levels
Light Blue is a Pivot Point – Black represents the price when the report was produced
Dow Jones Intraday: Resistance level at 31,189.00
Our pivot point is 31,189.00
Preferable Price Action: Take sell positions below pivot with targets at 30,904.00 & 30,708.00.
Alternative Price Action: Above 31,189.00 looks for further upside to 31,459.00 & 31,673.00.
Comment: RSI below 50 levels and Pair below 55MA.
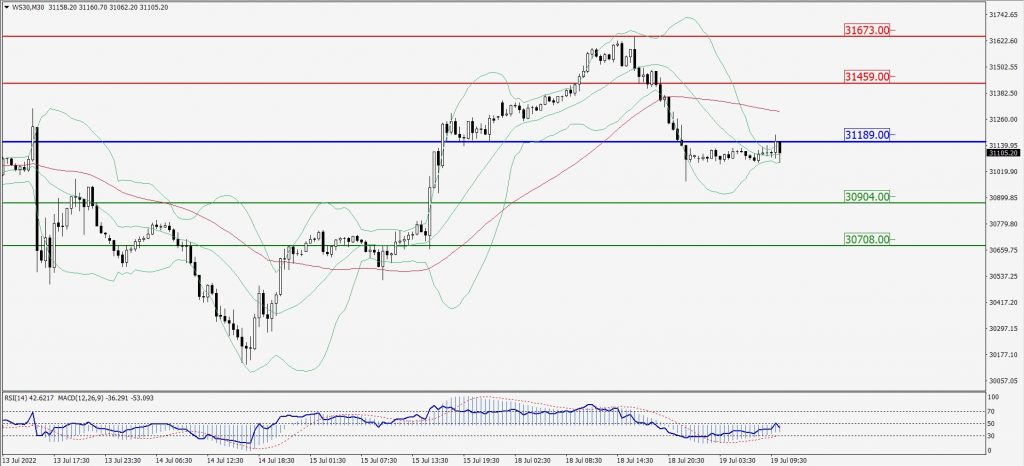
Green Lines Indicate Resistance Levels – Red Lines Indicate Support Levels
Light Blue is a Pivot Point – Black represents the price when the report was produced