Market Wrap: Stocks, Bonds, Commodities
The Nasdaq closed sharply lower on Thursday as the Federal Reserve’s announcement of a faster end to its pandemic-era stimulus pushed investors away from Big Tech and toward more economically sensitive sectors.
The Dow Jones Industrial Average fell 0.08% to end at 35,897.64, while the S&P 500 lost 0.87% to 4,668.67. The Nasdaq Composite dropped 385.10 points (2.47%) to 15,180.40.
MSCI’s index of Asia-Pacific stocks outside Japan slipped 0.82% to 777.33 levels. Australian index rose 0.11% to 7,304.00. Japanese Nikkei Index slumped 1.79% to 28,454.68.
European stocks were lower on Friday, with the Stoxx Europe 50 Index fell 0.56% to 4,180.25, Germany’s DAX lost 0.55% to 15,549.22, and France’s CAC slipped 0.40% to 6,977.26, and U.K.’s FTSE 100 rose 0.12% to 7,268.14.
Benchmark 10-year U.S. Treasury rose as demand for safe assets grows again, today 10-year bond yields fell 0.92% to 1.409.
Oil futures prices dropped toward $73 a barrel on Tuesday after the International Energy Agency (IEA) said the Omicron coronavirus variant is set to dent global demand recovery.
Spot Brent crude oil down 0.79% to $74.43 per barrel. US West Texas Intermediate crude lost 0.95% to $71.69 a barrel.
The yellow metal gold is advanced 0.53% to 1,807.65 dollars per ounce.
Market Wrap: Forex
The U.S. dollar remained under pressure on Friday, a day after the Bank of England and European Central Bank adopted more hawkish stances than markets had expected, giving a boost to sterling and the euro.
Today, the U.S. dollar index measures the greenback against a trade-weighted basket of six major currencies, which slipped 0.07% to 95.945.
The Euro US Dollar (EUR/USD) is a widely traded pair that is rose 0.05% today. This left the pairing trading around $1.13300.
The Japanese yen rose against the U.S. dollar on Friday as the stock pushes lower. Today US/JPY is fell 0.11% to 113.570 level.
Another commodity-related currency lower against the U.S dollar, AUD/USD slipped 0.26% to 0.71640, and NZD/USD declined 0.29% to 0.67670 level.
EUR/USD Intraday: Support at 1.13190
Our pivot point is at 1.13190
Preferable Price Action: Take Long positions Above pivot level with targets at 1.13660 & 1.13860 in extension.
Alternative Price Action: Below pivot looks for a further Downside to 1.12760 & 1.12530.
Comment: Pair above 20MA & 55MA and RSI above 50 levels.
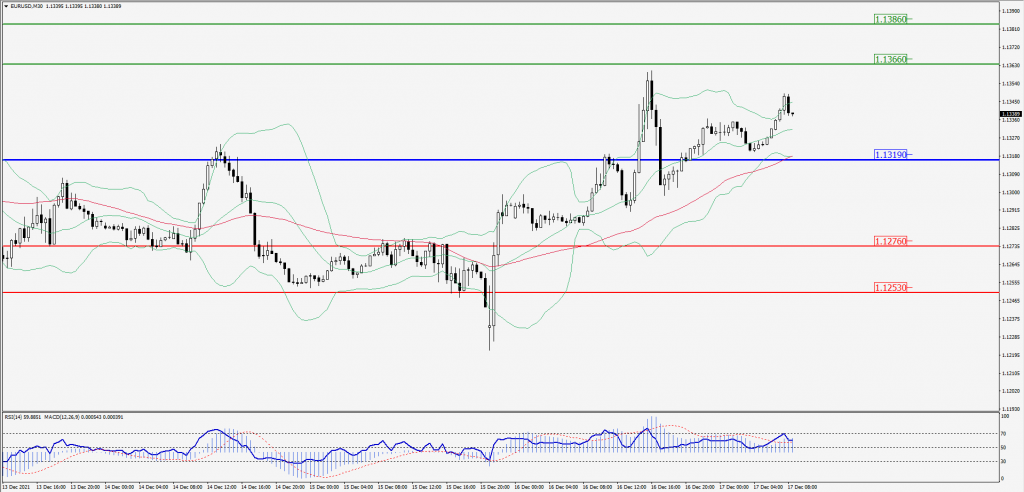
Green Lines Indicate Resistance Levels – Red Lines Indicates Support Levels
Light Blue is a Pivot Point – Black represents the price when the report was produced
GBP/USD Intraday: Trend on the upside
Our pivot point is at 1.32930
Preferable Price Action: Buy positions above pivot with targets at 1.33630 & 1.33930 in extension.
Alternative Price Action: The price below pivot would call for further downside to 1.32290 & 1.31990.
Comment: Pair above its 55MA & 20MA and RSI above 50 levels.
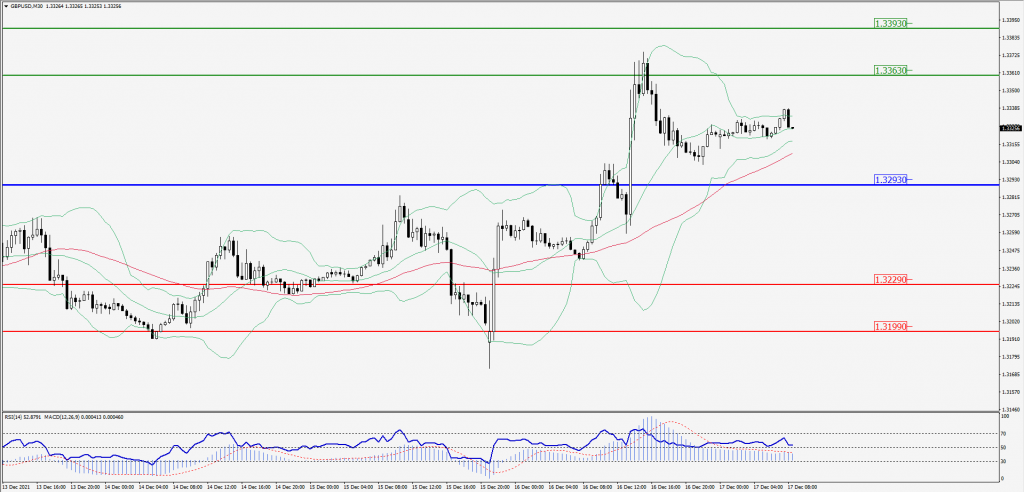
Green Lines Indicate Resistance Levels – Red Lines Indicates Support Levels
Light Blue is a Pivot Point – Black represents the price when the report was produced
USD/JPY Intraday: Trend on the downside
Our pivot point is at 113.700
Preferable Price Action: Sell position Below pivot with the target at 113.360 and 113.190 in extension.
Alternative Price Action: The Upside breakout of the pivot would call for 114.060 and 114.260.
Comment: Price below its 55MA and MACD in negative territory.
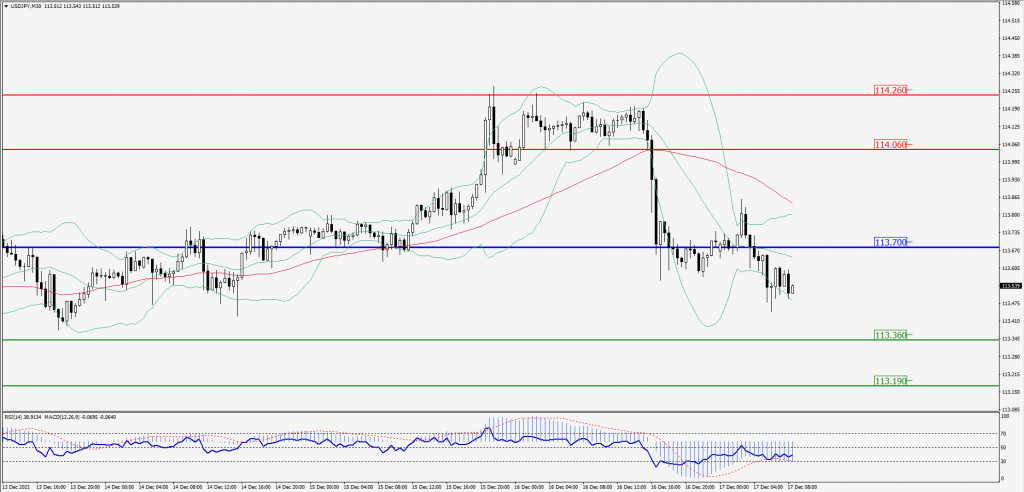
Green Lines Indicate Resistance Levels – Red Lines Indicates Support Levels
Light Blue is a Pivot Point – Black represents the price when the report was produced
AUD/USD Intraday: Trend may reverse from here
Our pivot point is at 0.71960
Preferable Price Action: Sell Positions below pivot with targets at 0.71430 & 0.71190 in extension.
Alternative Price Action: Above pivot looks for a further upside with 0.72400 & 0.72630 as targets.
Comment: Pair below its 55MA & 20MA and RSI below 50 levels.
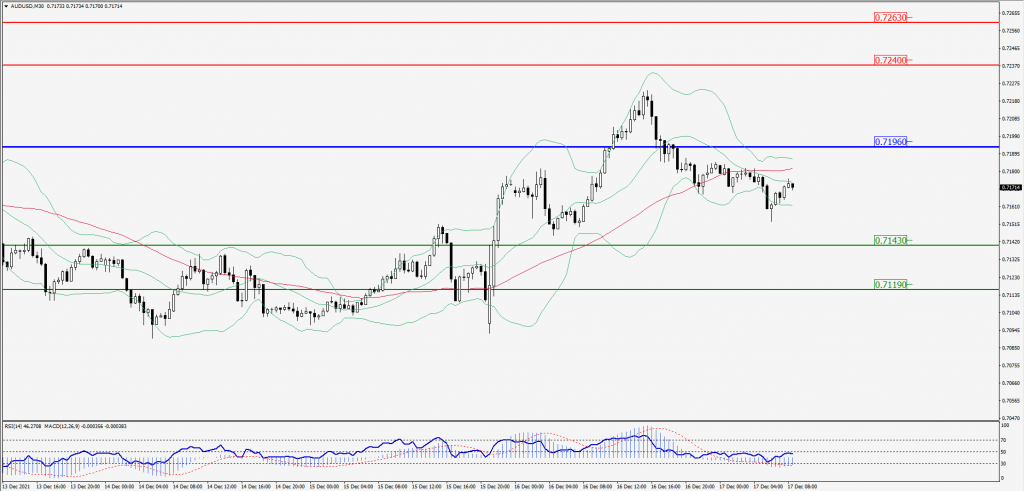
Green Lines Indicate Resistance Levels – Red Lines Indicates Support Levels
Light Blue is a Pivot Point – Black represents the price when the report was produced
CRUDEOIL Intraday: Trend on the upside
Our pivot point is at 70.60
Preferable Price Action: Above pivots Buy Oil with 72.60 & 73.60 as targets.
Alternative Price Action: Sell crude Below pivot with targets at 68.60 and 67.60 in extension.
Comment: Crude is below its 20MA and MACD in the negative territory.
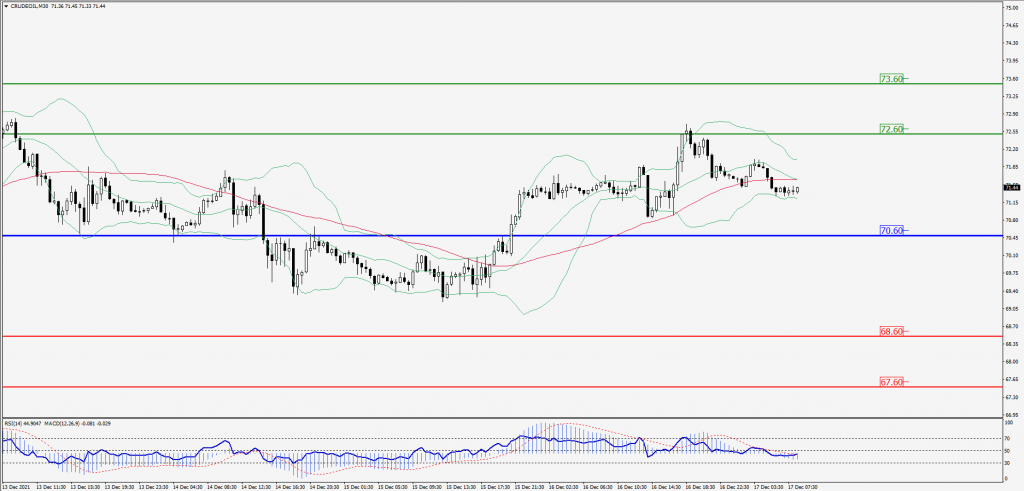
Green Lines Indicate Resistance Levels – Red Lines Indicates Support Levels
Light Blue is a Pivot Point – Black represents the price when the report was produced
XAU/USD Intraday: Break resistance levels
Our pivot point is 1796.00
Preferable Price Action: Further Upside to 1813.00 and 1823.00.
Alternative Price Action: If the price gives a downside breakout of a pivot, then the price extends to 1779.00 and 1769.00.
Comment: MACD in positive territory and price above its 20MA & 55MA.

Green Lines Indicate Resistance Levels – Red Lines Indicates Support Levels
Light Blue is a Pivot Point – Black represents the price when the report was produced
Dow Jones Intraday: Resistance 36,030.00
Our pivot point is 36,030.00
Preferable Price Action: Take long positions above pivot with targets at 36,390.00 & 36,560.00.
Alternative Price Action: Below 36,030.00 looks for further Downside to 35,630.00 & 35,430.00.
Comment: Price below its 55MA & 20MA and RSI below 50 levels.
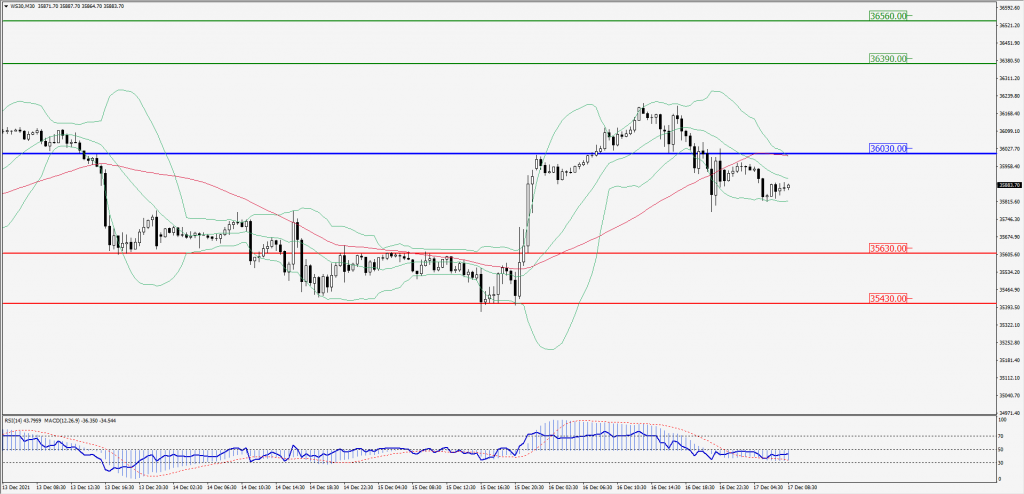
Green Lines Indicate Resistance Levels – Red Lines Indicates Support Levels
Light Blue is a Pivot Point – Black represents the price when the report was produced