Market Wrap: Stocks, Bonds, Commodities
The U.S. dollar rose broadly on Thursday, reversing a brief tumble in the immediate aftermath of the Federal Reserve’s outsized interest rate cut that had been largely priced in by markets.
The Dow Jones Industrial Average fail 103.08 points to 41,503.10, the S&P 500 loss 0.29% to 5,618.26 and the Nasdaq Composite descend 54.76 points to 17,573.30.
MSCI’s index of Asia-Pacific stocks outside Japan is up 0.89% to 705.09 levels. The Australian index was higher by 0.61% to 8,191.90. Japanese Nikkei Index increase 2.15% today.
European stocks were positive on Thursday, with the Stoxx Europe 50 Index increase 1.00% to 4,883.15 Germany’s DAX ascend 0.72% to 18,855.15, and France’s CAC higher 1.28% to 7,540.56 and U.K.’s FTSE 100 gain 0.84% to 8,323.25.
Benchmark 10-year U.S. Treasury rose as demand for safe assets slipped again, today 10-year bond yields 0.33% to 3.7050.
Oil prices rose on Thursday after a large interest rate cut from the U.S. Federal Reserve, but concerns over global demand lingered and capped gains.
Spot Brent crude oil decrease 0.71% to $74.17 per barrel. US West Texas Intermediate crude is increase 0.80% to $70.44 a barrel.
The yellow metal gold is up 0.19% to 2,603.55 dollars per ounce.
Market Wrap: Forex
Most Asian currencies moved in a flat-to-low range on Thursday as the dollar firmed sharply after an outsized interest rate cut by the Federal Reserve was offset by less dovish signals on future rates.
Today, the U.S. dollar index measures the Greenback against a trade-weighted basket of six major currencies, which increase 0.08% to 100.670.
The Euro US Dollar (EUR/USD) is a widely traded is up 0.23% today. This left the pair trading around $1.11440.
The Japanese yen was will move negative against the U.S. dollar on Thursday. Today USD/JPY is trades pair that decrease 0.06% to the 142.190 level.
Another commodity-related currency positive against the U.S dollar, AUD/USD gain 0.88% to 0.68230, and NZD/USD increase 0.60% to 0.62450 level.
EUR/USD Intraday: Trend on the upside
Our pivot point is at 1.11320
Preferable Price Action: Take buy positions above pivot level with targets at 1.11450 & 1.11580 in extension.
Alternative Price Action: Sell pivot looks for a further downside to 1.11190 & 1.11060.
Comment: RSI is above 50 levels and Pairs above its 20MA & 55MA.
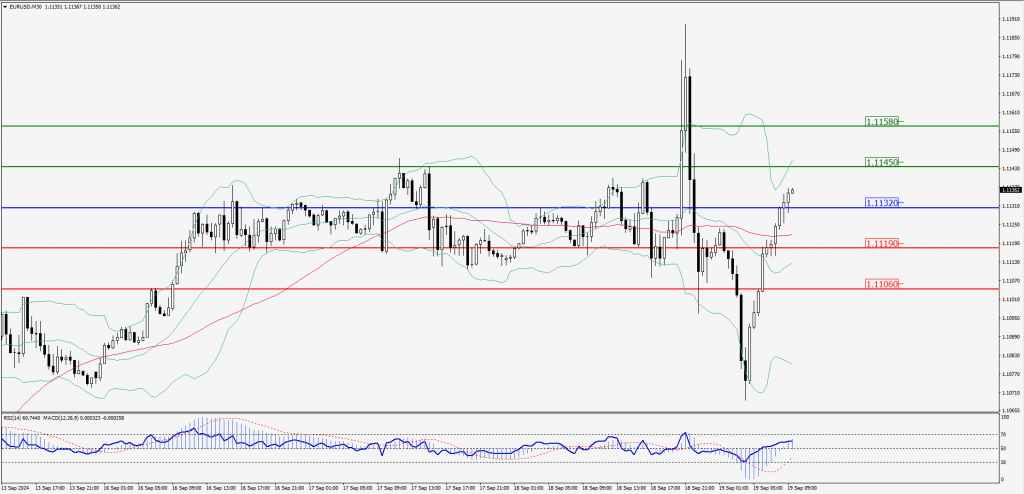
Green Lines Indicate Resistance Levels – Red Lines Indicate Support Levels
Light Blue is a Pivot Point – Black represents the price when the report was produced
GBP/USD Intraday: Trend on the upside
Our pivot point is at 1.32350
Preferable Price Action: Buy positions above pivot with targets at 1.32580 & 1.32810 in extension.
Alternative Price Action: The price below pivot would call for further downside to 1.32120 & 1.31890.
Comment: RSI is above 50 levels and Pairs above its 20MA & 55MA.
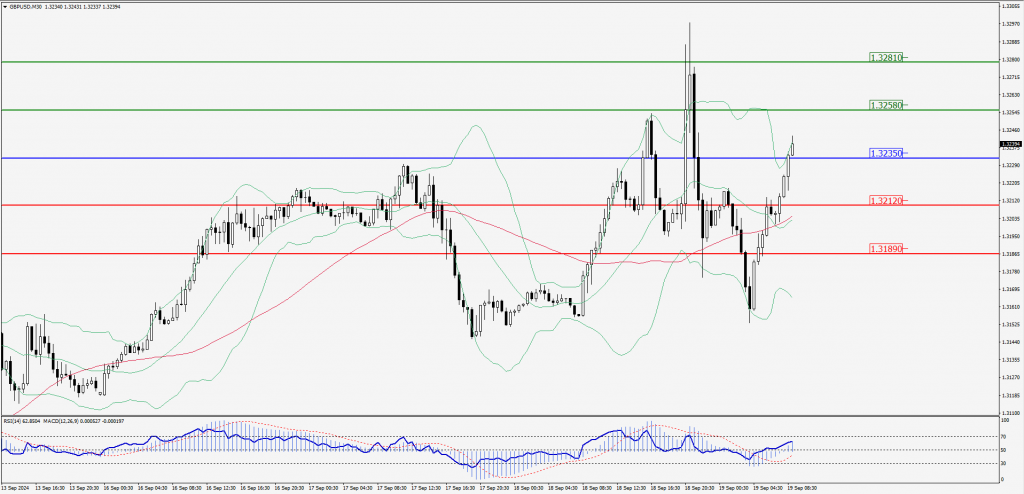
Green Lines Indicate Resistance Levels – Red Lines Indicate Support Levels
Light Blue is a Pivot Point – Black represents the price when the report was produced
USD/JPY Intraday: Trend on the downside
Our pivot point is at 142.640
Preferable Price Action: Sell position below pivot with the target at 142.060 and 141.540 in extension.
Alternative Price Action: The upside breakout of the pivot would call for 143.190 and 143.710.
Comment: MACD is below 50 levels and Pairs below its 20MA.
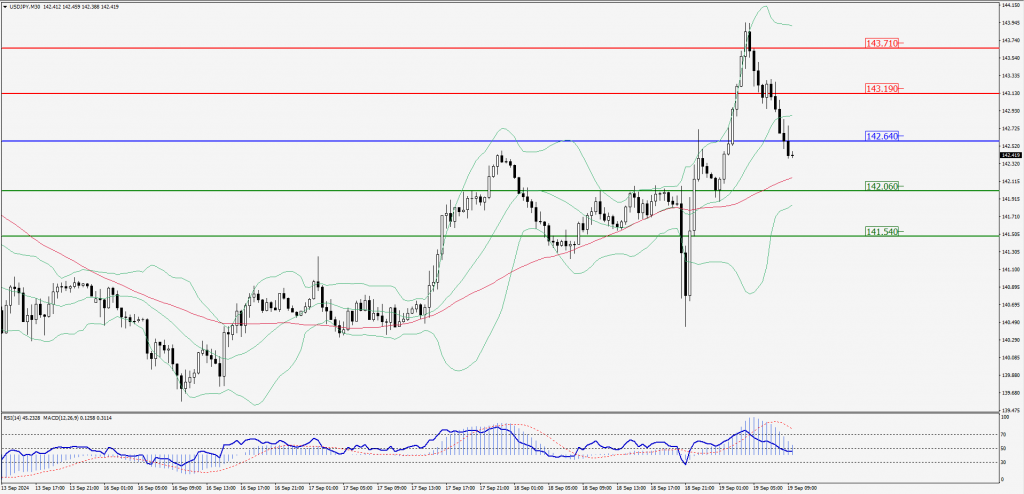
Green Lines Indicate Resistance Levels – Red Lines Indicate Support Levels
Light Blue is a Pivot Point – Black represents the price when the report was produced
AUD/USD Intraday: Trend on the upside
Our pivot point is at 0.68030
Preferable Price Action: Buy positions above pivot with targets at 0.68180 & 0.68310 in extension.
Alternative Price Action: Below pivot a further downside with 0.67880 & 0.67740 as targets.
Comment: RSI is above 50 levels and pairs above its 20MA & 55MA.
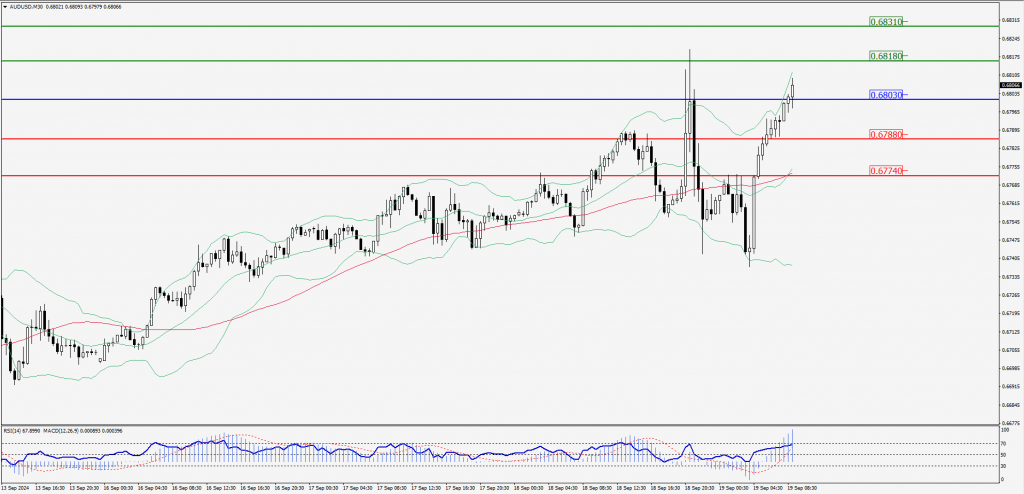
Green Lines Indicate Resistance Levels – Red Lines Indicate Support Levels
Light Blue is a Pivot Point – Black represents the price when the report was produced
CRUDEOIL Intraday: Trend on the upside
Our pivot point is at 70.17
Preferable Price Action: Above pivot buy oil with 70.54 & 70.87 as targets.
Alternative Price Action: Sell crude below pivot with targets at 69.81 and 69.47 in extension.
Comment: RSI is at above 50 levels and pairs above its 20MA & 55MA.
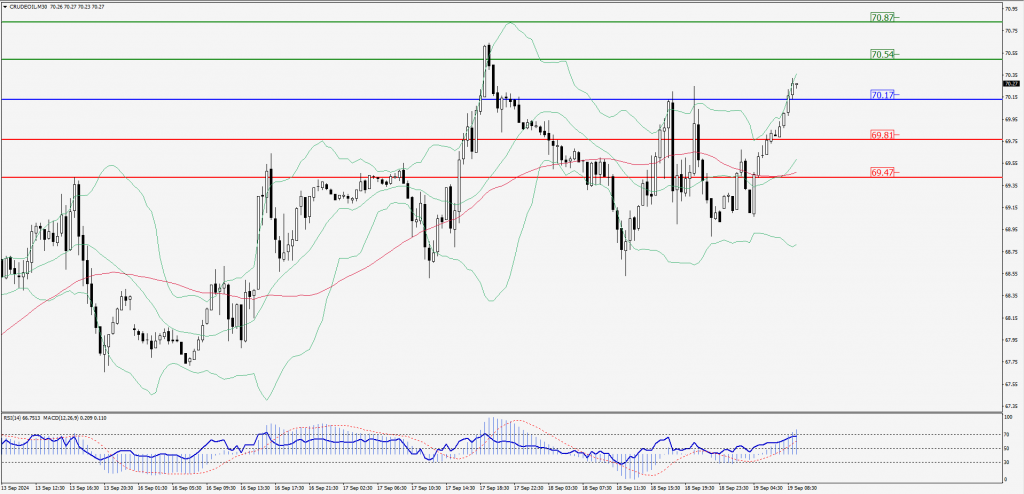
Green Lines Indicate Resistance Levels – Red Lines Indicate Support Levels
Light Blue is a Pivot Point – Black represents the price when the report was produced
XAU/USD Intraday: Trend on the upside
Our pivot point is at 2573.60
Preferable Price Action: Further upside to 2580.80 and 2587.80.
Alternative Price Action: If the price gives an downside breakout of a pivot, then the price extends to 2565.60 and 2558.50.
Comment: MACD is above 50 levels and pairs above its 20MA & 55MA.
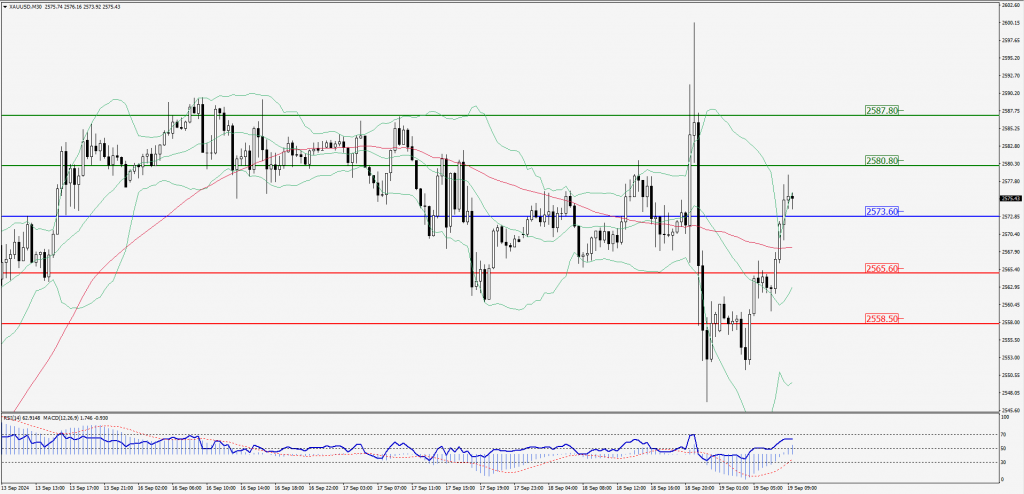
Green Lines Indicate Resistance Levels – Red Lines Indicate Support Levels
Light Blue is a Pivot Point – Black represents the price when the report was produced
Dow Jones Intraday: Trend on the upside
Our pivot point is 41,756.10
Preferable Price Action: Take buy positions above the pivot with targets at 41,876.10 & 41,992.40.
Alternative Price Action: Below 41,756.10 looks for further downside to 41,637.40 & 41,519.80.
Comment: RSI is above 50 levels and pairs above its 20MA & 55MA.
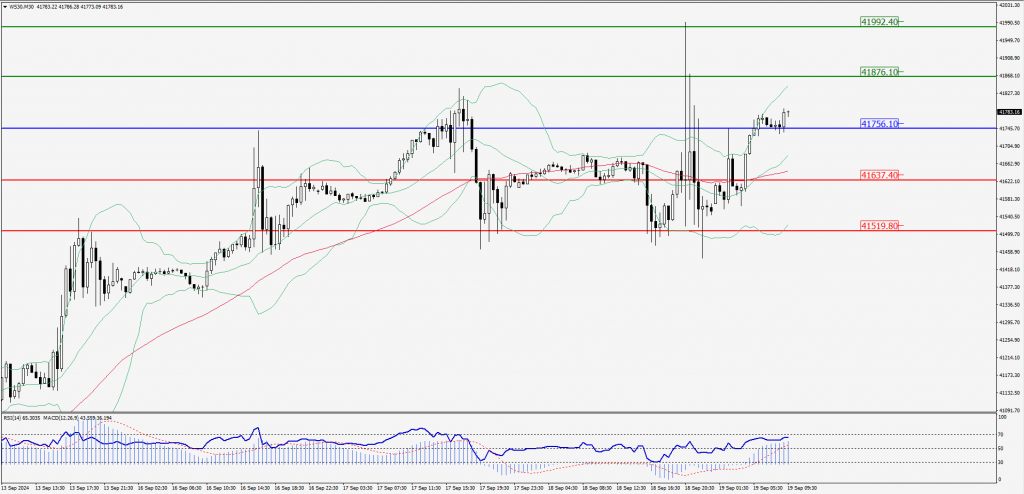
Green Lines Indicate Resistance Levels – Red Lines Indicate Support Levels
Light Blue is a Pivot Point – Black represents the price when the report was produced