Market Wrap: Stocks, Bonds, Commodities
Most Asian currencies firmed on Friday, while the dollar nursed losses after the Federal Reserve cut rates by a wide margin and kicked off an easing cycle.
The Dow Jones Industrial Average rose 522.09 points to 42,025.19, the S&P 500 gain 1.70% to 5,713.64 and the Nasdaq Composite ascend 440.68 points to 18,013.98.
MSCI’s index of Asia-Pacific stocks outside Japan is up 2.08% to 711.28 levels. The Australian index was higher by 0.21% to 8,209.50. Japanese Nikkei Index increase 1.67% today.
European stocks were negative on Friday, with the Stoxx Europe 50 Index decrease 0.50% to 4,918.45 Germany’s DAX descend 0.66% to 18,874.75, and France’s CAC lower 0.24% to 7,597.22 and U.K.’s FTSE 100 loss 0.59% to 8,279.19.
Benchmark 10-year U.S. Treasury rose as demand for safe assets slipped again, today 10-year bond yields 0.33% to 3.7210.
Oil prices, which eased on Friday, were on track to end higher for a second straight week following a large cut in U.S. interest rates and declining global stockpiles.
Spot Brent crude oil decrease 0.16% to $74.76 per barrel. US West Texas Intermediate crude is decrease 0.11% to $71.08 a barrel.
The yellow metal gold is up 0.72% to 2,633.40 dollars per ounce.
Market Wrap: Forex
The Japanese yen was among the better performers, strengthening after the Bank of Japan held interest rates and said it expected steady increases in inflation and economic growth.
Today, the U.S. dollar index measures the Greenback against a trade-weighted basket of six major currencies, which decrease 0.07% to 100.550.
The Euro US Dollar (EUR/USD) is a widely traded is up 0.16% today. This left the pair trading around $1.11790.
The Japanese yen was will move positive against the U.S. dollar on Friday. Today USD/JPY is trades pair that increase 0.22% to the 142.930 level.
Another commodity-related currency positive against the U.S dollar, AUD/USD gain 0.09% to 0.68200, and NZD/USD increase 0.22% to 0.62510 level.
EUR/USD Intraday: Trend on the upside
Our pivot point is at 1.11710
Preferable Price Action: Take buy positions above pivot level with targets at 1.11840 & 1.11970 in extension.
Alternative Price Action: Sell pivot looks for a further downside to 1.11570 & 1.11440.
Comment: RSI is above 50 levels and Pairs above its 20MA & 55MA.
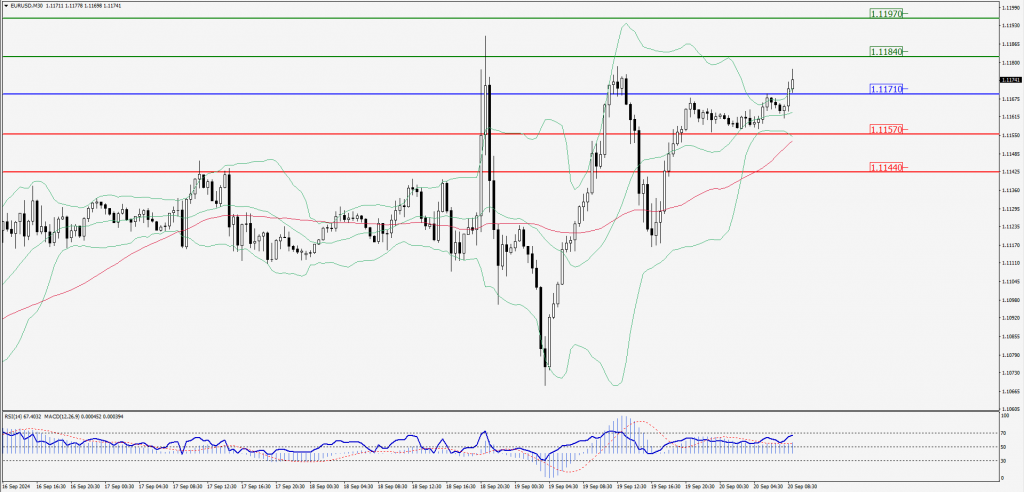
Green Lines Indicate Resistance Levels – Red Lines Indicate Support Levels
Light Blue is a Pivot Point – Black represents the price when the report was produced
GBP/USD Intraday: Major trend on the upside
Our pivot point is at 1.33230
Preferable Price Action: Buy positions above pivot with targets at 1.33530 & 1.33780 in extension.
Alternative Price Action: The price below pivot would call for further downside to 1.32930 & 1.32670.
Comment: RSI is above 50 levels and Pairs above its 20MA & 55MA.
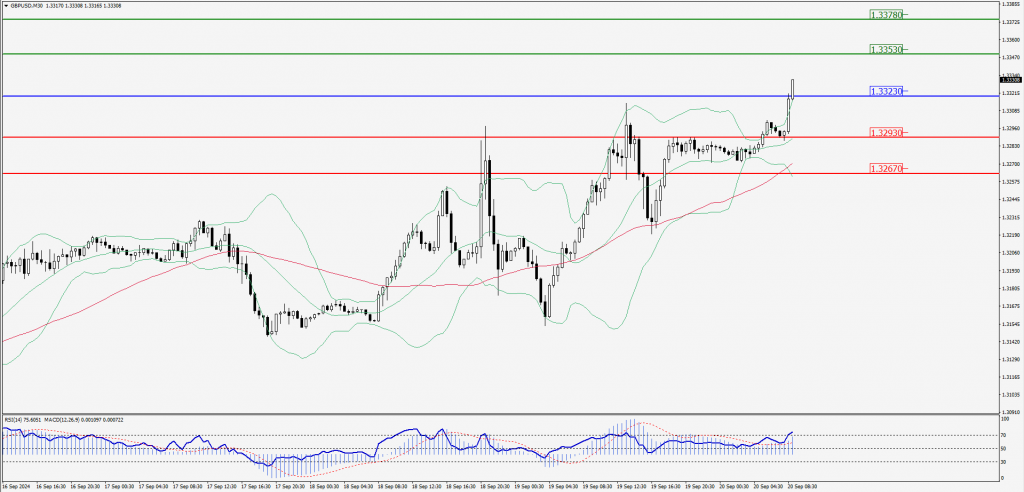
Green Lines Indicate Resistance Levels – Red Lines Indicate Support Levels
Light Blue is a Pivot Point – Black represents the price when the report was produced
USD/JPY Intraday: Trend on the downside
Our pivot point is at 142.640
Preferable Price Action: Sell position below pivot with the target at 142.060 and 141.530 in extension.
Alternative Price Action: The upside breakout of the pivot would call for 143.170 and 143.700.
Comment: MACD is below 50 levels and Pairs below its 55MA.
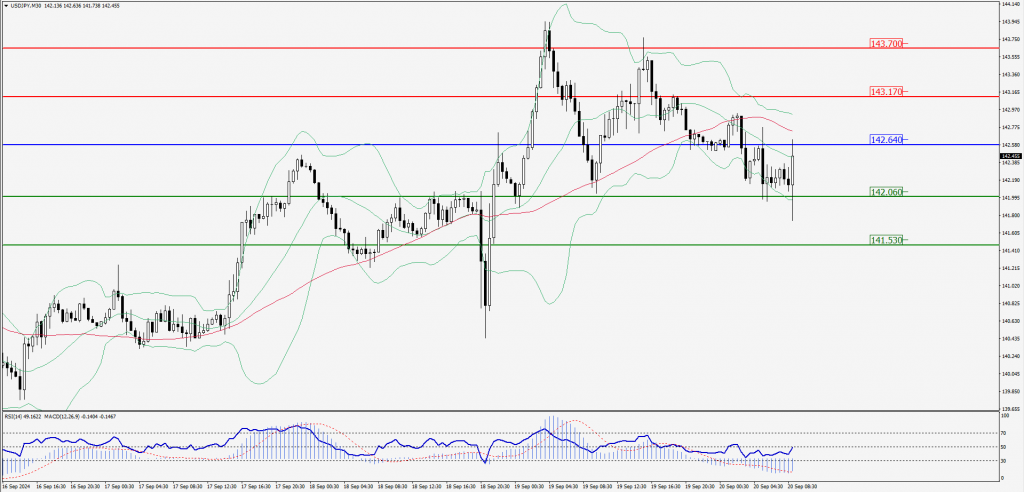
Green Lines Indicate Resistance Levels – Red Lines Indicate Support Levels
Light Blue is a Pivot Point – Black represents the price when the report was produced
AUD/USD Intraday: Trend on the upside
Our pivot point is at 0.68220
Preferable Price Action: Buy positions above pivot with targets at 0.68390 & 0.68520 in extension.
Alternative Price Action: Below pivot a further downside with 0.68060 & 0.67920 as targets.
Comment: RSI is above 50 levels and pairs above its 20MA & 55MA.
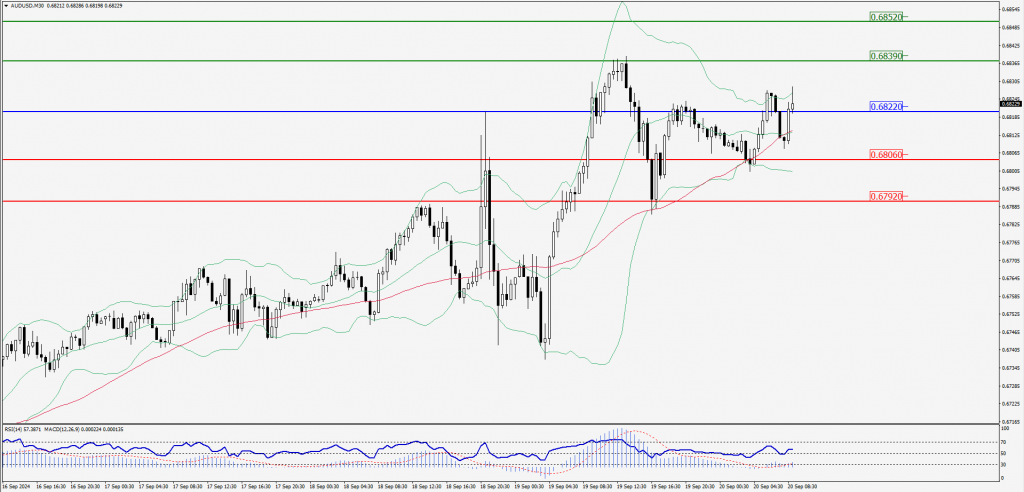
Green Lines Indicate Resistance Levels – Red Lines Indicate Support Levels
Light Blue is a Pivot Point – Black represents the price when the report was produced
CRUDEOIL Intraday: Trend on the upside
Our pivot point is at 70.85
Preferable Price Action: Above pivot buy oil with 71.23 & 71.57 as targets.
Alternative Price Action: Sell crude below pivot with targets at 70.47 and 70.12 in extension.
Comment: RSI is at above 50 levels and pairs above its 20MA & 55MA.
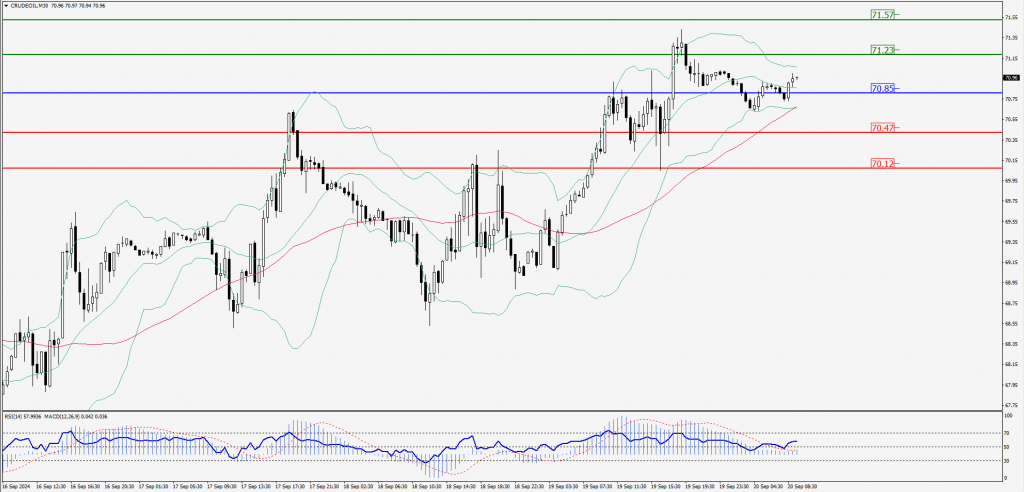
Green Lines Indicate Resistance Levels – Red Lines Indicate Support Levels
Light Blue is a Pivot Point – Black represents the price when the report was produced
XAU/USD Intraday: Major trend on the upside
Our pivot point is at 2597.90
Preferable Price Action: Further upside to 2604.80 and 2611.30.
Alternative Price Action: If the price gives an downside breakout of a pivot, then the price extends to 2591.10 and 2584.50.
Comment: MACD is above 50 levels and pairs above its 20MA & 55MA.
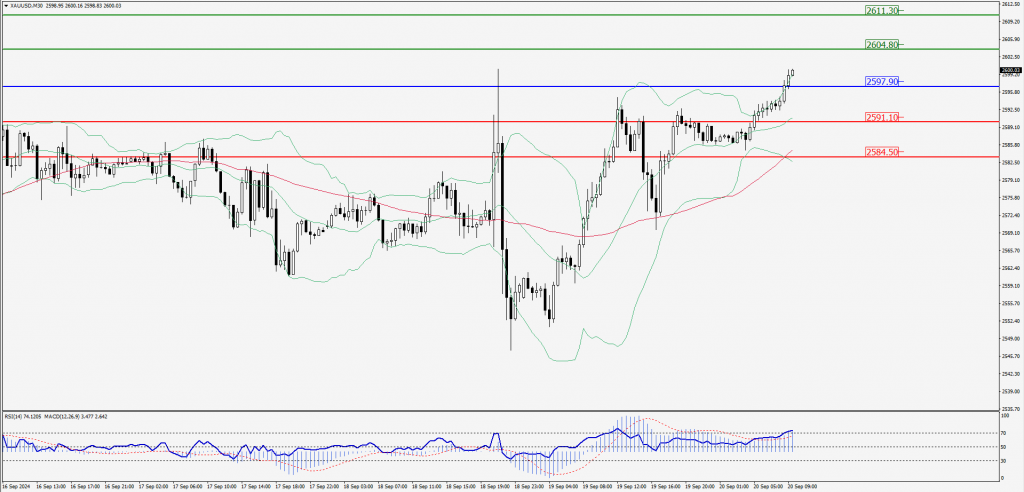
Green Lines Indicate Resistance Levels – Red Lines Indicate Support Levels
Light Blue is a Pivot Point – Black represents the price when the report was produced
Dow Jones Intraday: Trend on the upside
Our pivot point is 42,020.20
Preferable Price Action: Take buy positions above the pivot with targets at 42,111.30 & 42,195.30.
Alternative Price Action: Below 42,020.20 looks for further downside to 41,922.00 & 41,826.20.
Comment: RSI is above 50 levels and pairs above its 20MA & 55MA.
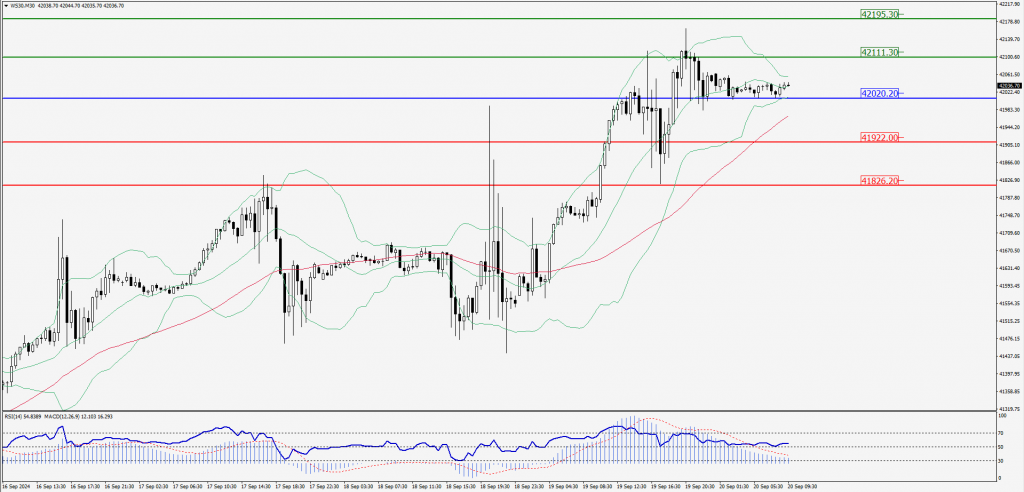
Green Lines Indicate Resistance Levels – Red Lines Indicate Support Levels
Light Blue is a Pivot Point – Black represents the price when the report was produced