Market Wrap: Stocks, Bonds, Commodities
The S&P 500 eked out a slight gain in a subdued session while the Nasdaq fell on Monday, weighed down by a drop in technology stocks as investors assessed the likelihood of an upsized rate cut from the U.S. Federal Reserve this week.
The Dow Jones Industrial Average rose 228.30 points to 41,622.08, the S&P 500 gain 0.13% to 5,633.09 and the Nasdaq Composite descend 91.85 points to 17,592.13.
MSCI’s index of Asia-Pacific stocks outside Japan is up 0.87% to 699.35 levels. The Australian index was higher by 0.24% to 8,140.90. Japanese Nikkei Index decrease 1.03% today.
European stocks were positive on Tuesday, with the Stoxx Europe 50 Index increase 0.40% to 4,846.85 Germany’s DAX ascend 0.45% to 18,712.15, and France’s CAC higher 0.50% to 7,486.97 and U.K.’s FTSE 100 gain 0.64% to 8,331.67.
Benchmark 10-year U.S. Treasury fail as demand for safe assets slipped again, today 10-year bond yields 0.45% to 3.6080.
Oil prices were trading higher as the ongoing impact of Hurricane Francine on output in the U.S. Gulf of Mexico offset persistent Chinese demand concerns ahead of this week’s U.S. Federal Reserve interest rate cut decision.
Spot Brent crude oil increase 0.32% to $72.98 per barrel. US West Texas Intermediate crude is increase 0.54% to $69.39 a barrel.
The yellow metal gold is up 0.06% to 2,610.55 dollars per ounce.
Market Wrap: Forex
The dollar traded near its lowest levels of the year on Tuesday, on the eve of the expected the start to a U.S. easing cycle that markets are betting may begin with an outsized rate cut.
Today, the U.S. dollar index measures the Greenback against a trade-weighted basket of six major currencies, which decrease 0.02% to 100.415.
The Euro US Dollar (EUR/USD) is a widely traded is down 0.14% today. This left the pair trading around $1.11160.
The Japanese yen was will move negative against the U.S. dollar on Tuesday. Today USD/JPY is trades pair that decrease 0.15% to the 140.390 level.
Another commodity-related currency mixed against the U.S dollar, AUD/USD gain 0.06% to 0.67550, and NZD/USD decrease 0.04% to 0.61980 level.
EUR/USD Intraday: Trend on the upside
Our pivot point is at 1.11280
Preferable Price Action: Take buy positions above pivot level with targets at 1.11500 & 1.11680 in extension.
Alternative Price Action: Sell pivot looks for a further downside to 1.11070 & 1.10900.
Comment: RSI is above 50 levels and Pairs above its 55MA & 20MA.
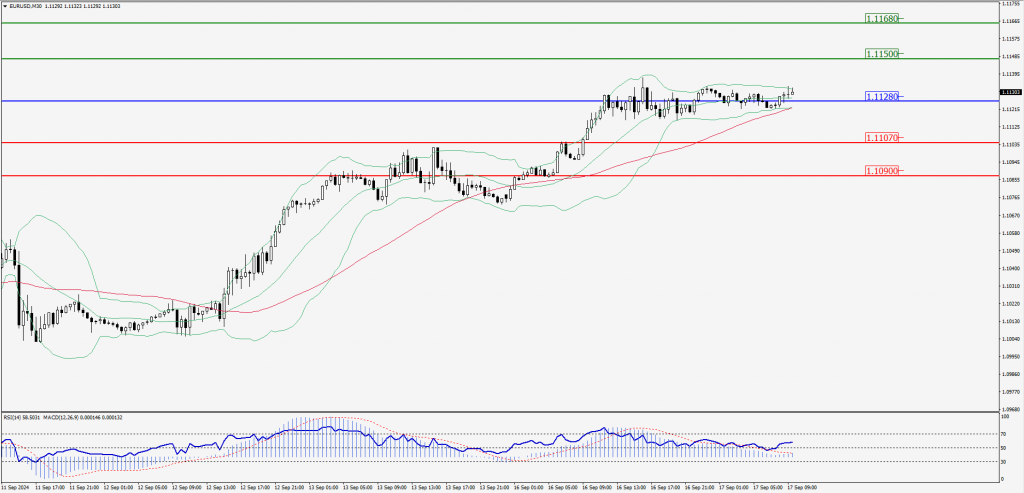
Green Lines Indicate Resistance Levels – Red Lines Indicate Support Levels
Light Blue is a Pivot Point – Black represents the price when the report was produced
GBP/USD Intraday: Trend on the upside
Our pivot point is at 1.32030
Preferable Price Action: Buy positions above pivot with targets at 1.31750 & 1.31520 in extension.
Alternative Price Action: The price below pivot would call for further downside to 1.32330 & 1.32550.
Comment: RSI is above 50 levels and Pairs above its 55MA.
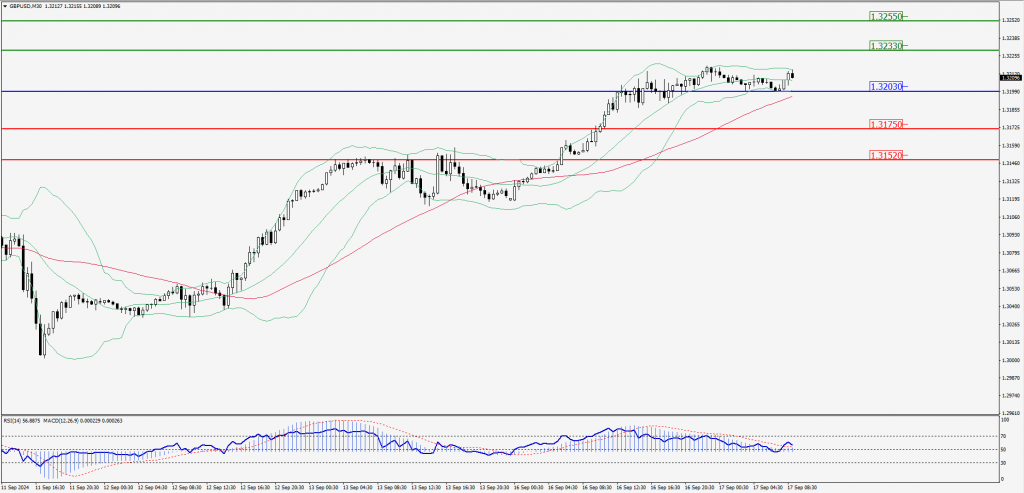
Green Lines Indicate Resistance Levels – Red Lines Indicate Support Levels
Light Blue is a Pivot Point – Black represents the price when the report was produced
USD/JPY Intraday: Trend on the upside
Our pivot point is at 140.510
Preferable Price Action: Buy position above pivot with the target at 140.960 and 141.380 in extension.
Alternative Price Action: The downside breakout of the pivot would call for 140.060 and 139.650.
Comment: MACD is above 50 levels and Pairs above its 55MA.
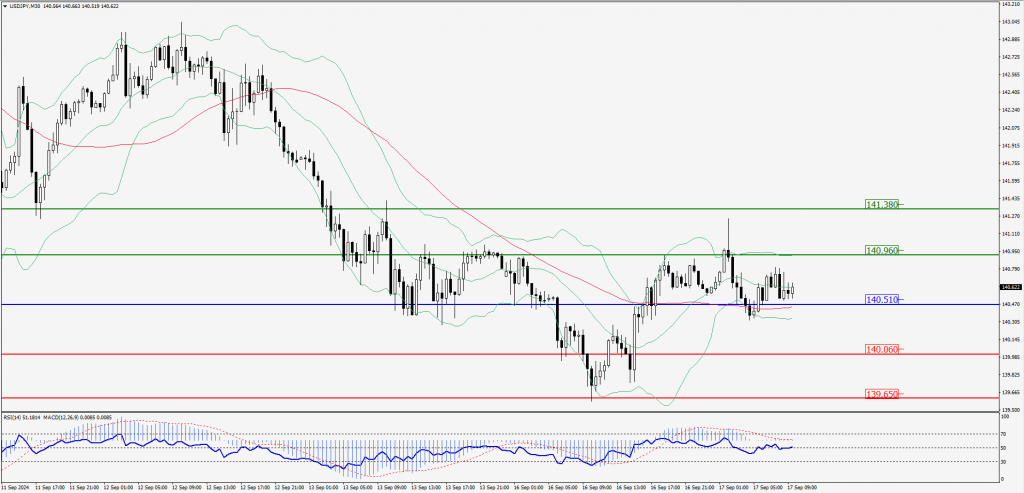
Green Lines Indicate Resistance Levels – Red Lines Indicate Support Levels
Light Blue is a Pivot Point – Black represents the price when the report was produced
AUD/USD Intraday: Trend on the upside
Our pivot point is at 0.67540
Preferable Price Action: Buy positions above pivot with targets at 0.67720 & 0.67890 in extension.
Alternative Price Action: Below pivot a further downside with 0.67340 & 0.67170 as targets.
Comment: RSI is above 50 levels and pairs above its 20MA & 55MA.
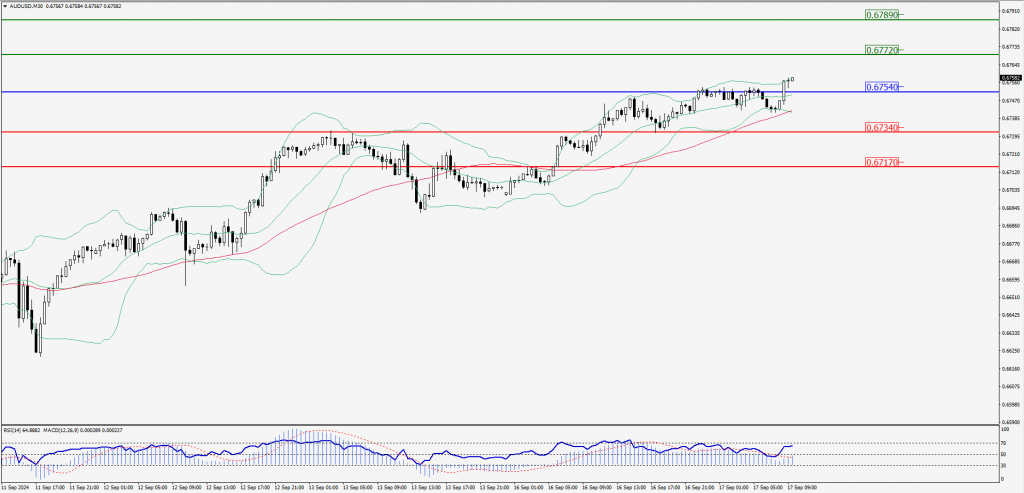
Green Lines Indicate Resistance Levels – Red Lines Indicate Support Levels
Light Blue is a Pivot Point – Black represents the price when the report was produced
CRUDEOIL Intraday: Trend on the upside
Our pivot point is at 69.37
Preferable Price Action: Above pivot buy oil with 70.08 & 70.72 as targets.
Alternative Price Action: Sell crude below pivot with targets at 68.65 and 68.01 in extension.
Comment: RSI is at above 50 levels and pairs above its 20MA & 55MA.
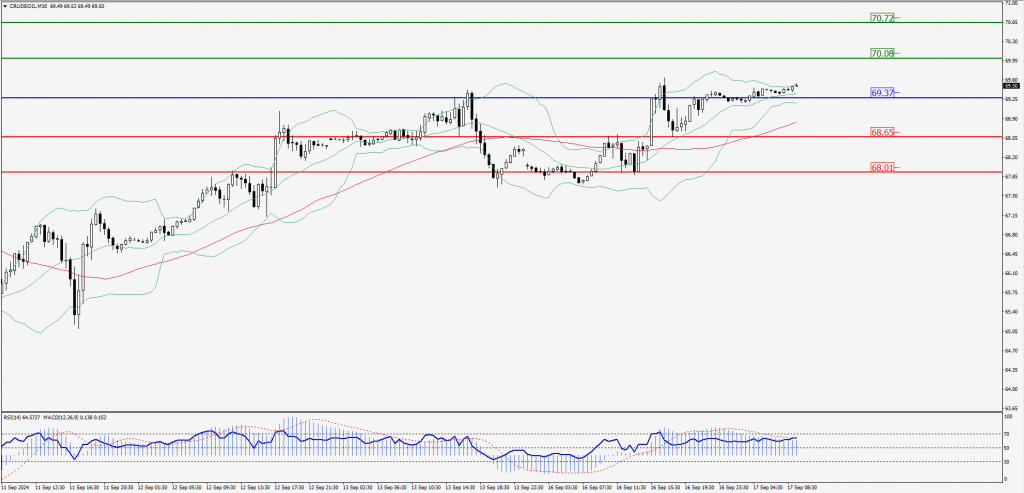
Green Lines Indicate Resistance Levels – Red Lines Indicate Support Levels
Light Blue is a Pivot Point – Black represents the price when the report was produced
XAU/USD Intraday: Trend on the upside
Our pivot point is at 2584.20
Preferable Price Action: Further upside to 2598.80 and 2612.30.
Alternative Price Action: If the price gives an downside breakout of a pivot, then the price extends to 2569.00 and 2556.00.
Comment: MACD is above 50 levels and pairs above its 20MA & 55MA.
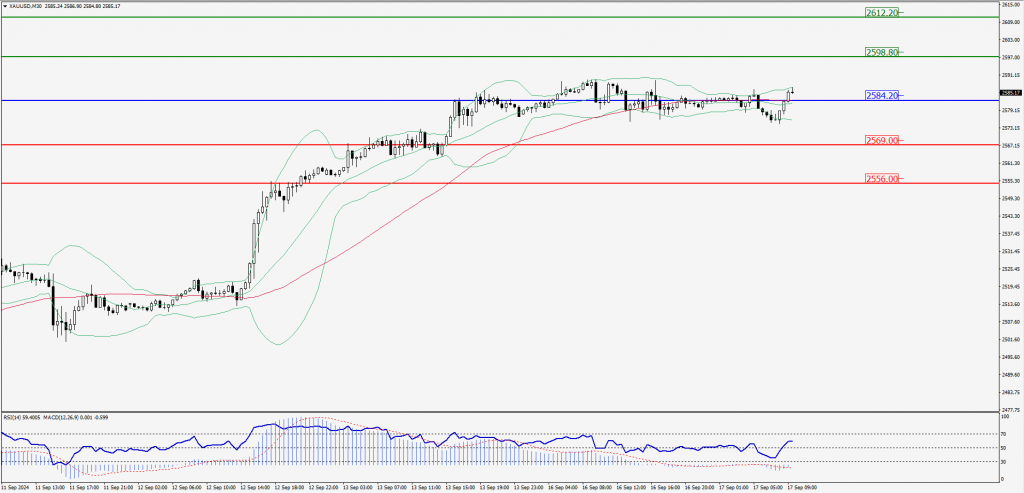
Green Lines Indicate Resistance Levels – Red Lines Indicate Support Levels
Light Blue is a Pivot Point – Black represents the price when the report was produced
Dow Jones Intraday: Trend on the upside
Our pivot point is 41,598.60
Preferable Price Action: Take buy positions above the pivot with targets at 41,794.70 & 41,987.70.
Alternative Price Action: Below 41,446.60 looks for further downside to 41,402.50 & 41,224.80.
Comment: RSI is above 50 levels and pairs above its 20MA & 50MA.
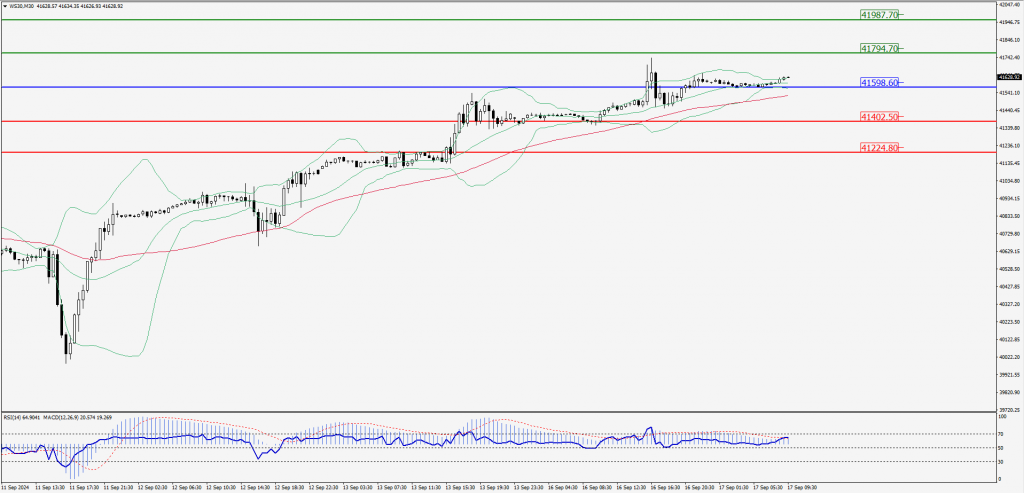
Green Lines Indicate Resistance Levels – Red Lines Indicate Support Levels
Light Blue is a Pivot Point – Black represents the price when the report was produced