Market Wrap: Stocks, Bonds, Commodities
Wall Street ended sharply lower on Wednesday, with Target losing around a quarter of its stock market value and highlighting worries about the US economy after the retailer became the latest victim of surging prices.
The S&P 500 lose (4.04%) ended at 3,923.68 points, while the Nasdaq Composite down 4.73% to 11,418.15. The Dow Jones Industrial was fell 3.57% to 31,490.07.
MSCI’s index of Asia-Pacific stocks outside Japan is drop 2.24% to 647.00 levels. Australian index lower 1.65% to 7,064.50. Japanese Nikkei Index drop 1.89% to 26,402.84.
European stocks were negative on Thursday, with the Stoxx Europe 50 Index lose 2.05% to 3,614.05, Germany’s DAX drop 1.97% to 13,732.02, and France’s CAC down 1.90% to 6,231.98, and U.K.’s FTSE 100 decrease 2.02% to 7,287.60.
Benchmark 10-year U.S. Treasury fell as demand for safe assets ascend again, today 10-year bond yields a negative 2.8520.
Oil prices rose on Thursday, recovering from early losses, on hopes that planned easing of restrictions in Shanghai could improve fuel demand while lingering concerns over tight global supplies outweighed fears of slower economic growth.
Spot Brent crude oil rose 0.50% to $109.64 per barrel. US West Texas Intermediate crude is up 0.11% to $107.16 a barrel.
The yellow metal gold is decline 0.27% to 1,810.85 dollars per ounce.
Market Wrap: Forex
The U.S. dollar edged lower in early European trade Thursday, handing back some of the previous session’s substantial gains although the safe haven remains in demand with risk sentiment fragile.
Today, the U.S. dollar index measures the Greenback against a trade-weighted basket of six major currencies, which is a rose of 0.13% to 103.720.
The Euro US Dollar (EUR/USD) is a widely traded pair that is up 0.17% today. This left the pair trading around $1.04830.
The Japanese yen was positive against the U.S. dollar on Thursday as the stock up. Today USD/JPY is lose 0.07% to 128.130 level.
Another commodity-related currency positive against the U.S dollar, AUD/USD ascend 0.43 to 0.69830, and NZD/USD higher 0.54% to 0.63290 level.
EUR/USD Intraday: Trend on The Downside
Our pivot point is at 1.04910
Preferable Price Action: Take sell positions below pivot level with targets at 1.04360 & 1.03900 in extension.
Alternative Price Action: Above pivot looks for a further upside to 1.05420 & 1.05840.
Comment: RSI below 50 levels and Pair below its 20MA & 55MA.
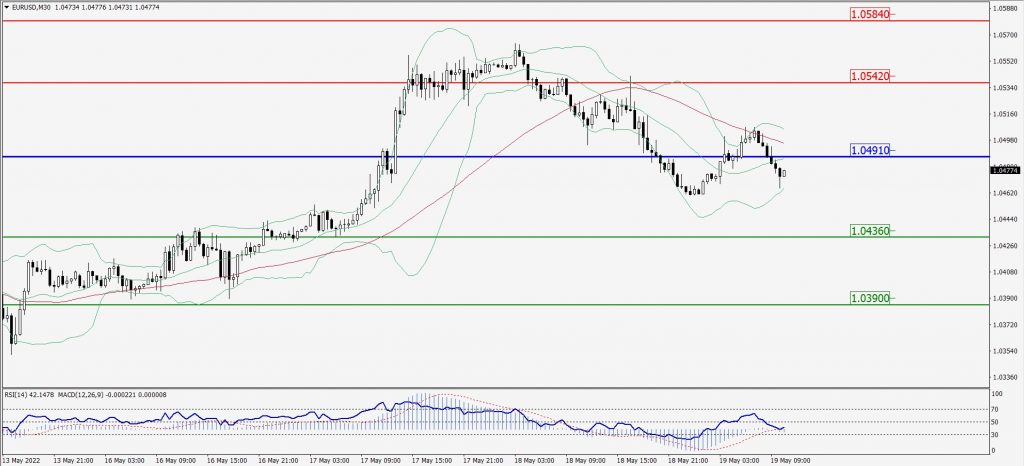
Green Lines Indicate Resistance Levels – Red Lines Indicate Support Levels
Light Blue is a Pivot Point – Black represents the price when the report was produced
GBP/USD Intraday: In a Consolidation Zone
Our pivot point is at 1.23870
Preferable Price Action: Sell positions below pivot with targets at 1.22660 & 1.21700 in extension.
Alternative Price Action: The price above pivot would call for further upside to 1.25060 & 1.25950.
Comment: RSI below 50 levels pair below its 20MA & 55MA.
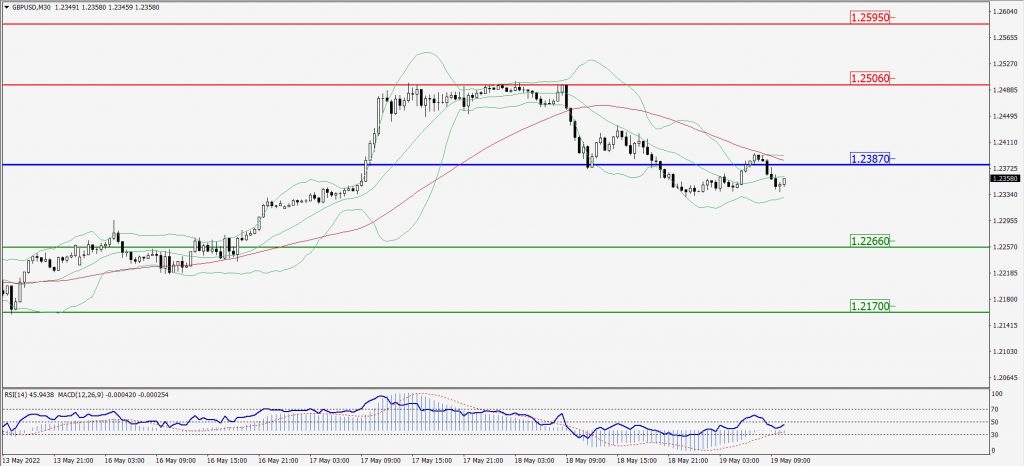
Green Lines Indicate Resistance Levels – Red Lines Indicate Support Levels
Light Blue is a Pivot Point – Black represents the price when the report was produced
USD/JPY Intraday: Major Resistance Level at 128.470
Our pivot point is at 128.470
Preferable Price Action: Sell position below pivot with the target at 127.570 and 126.870 in extension.
Alternative Price Action: The upside breakout of the pivot would call for 129.330 and 130.140.
Comment: MACD is negative territory and Pair below its 20MA & 55MA.
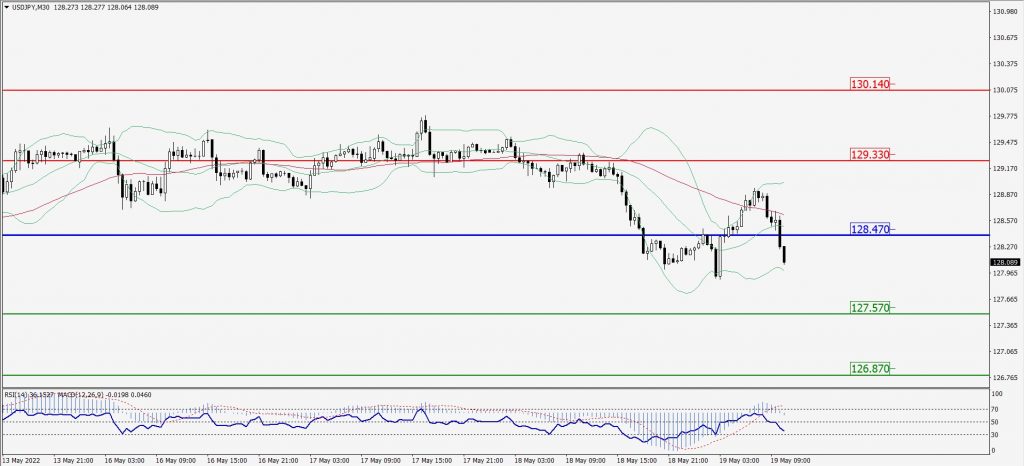
Green Lines Indicate Resistance Levels – Red Lines Indicate Support Levels
Light Blue is a Pivot Point – Black represents the price when the report was produced
AUD/USD Intraday: Trend on The Downside
Our pivot point is at 0.69970
Preferable Price Action: Sell Positions below pivot with targets at 0.69300 & 0.68730 in extension.
Alternative Price Action: Above pivot looks for a further upside with 0.70620 & 0.71180 as targets.
Comment: RSI below 50 levels and Pair below its 20MA & 55MA.
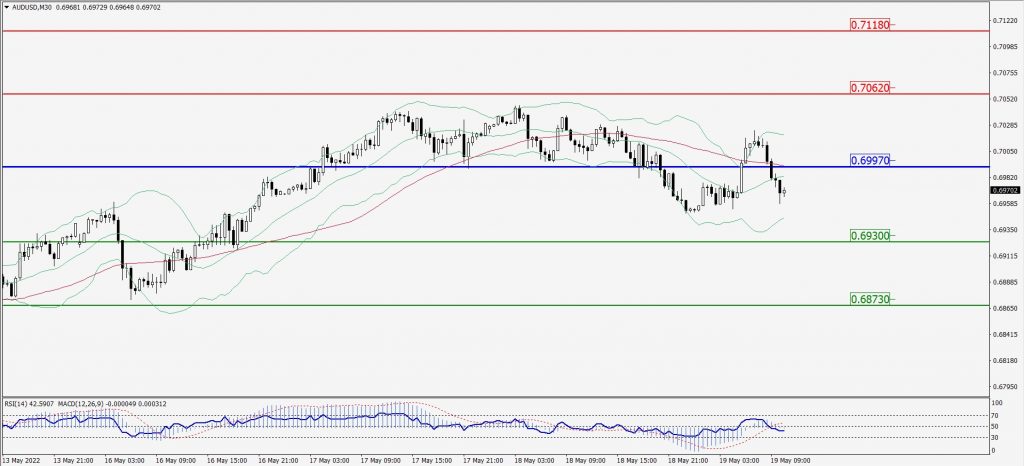
Green Lines Indicate Resistance Levels – Red Lines Indicate Support Levels
Light Blue is a Pivot Point – Black represents the price when the report was produced
CRUDEOIL Intraday: In a Consolidation Zone
Our pivot point is at 108.10
Preferable Price Action: Below pivots Sell oil with 104.60 & 101.70 as targets.
Alternative Price Action: Buy crude above pivot with targets at 112.00 and 115.20 in extension.
Comment: MACD is in the negative territory and Pair below 55MA.
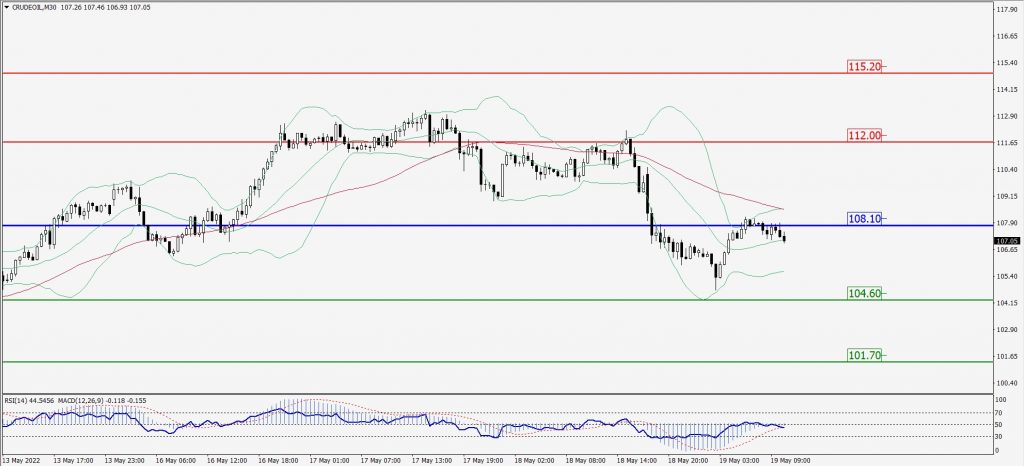
Green Lines Indicate Resistance Levels – Red Lines Indicate Support Levels
Light Blue is a Pivot Point – Black represents the price when the report was produced
XAU/USD Intraday: Major Resistance Level at 1817.20
Our pivot point is 1817.20
Preferable Price Action: Further downside to 1804.00 and 1792.20.
Alternative Price Action: If the price gives an upside breakout of a pivot, then the price extends to 1828.10 and 1837.90.
Comment: MACD is negative territory and pair below its 20MA & 55MA.
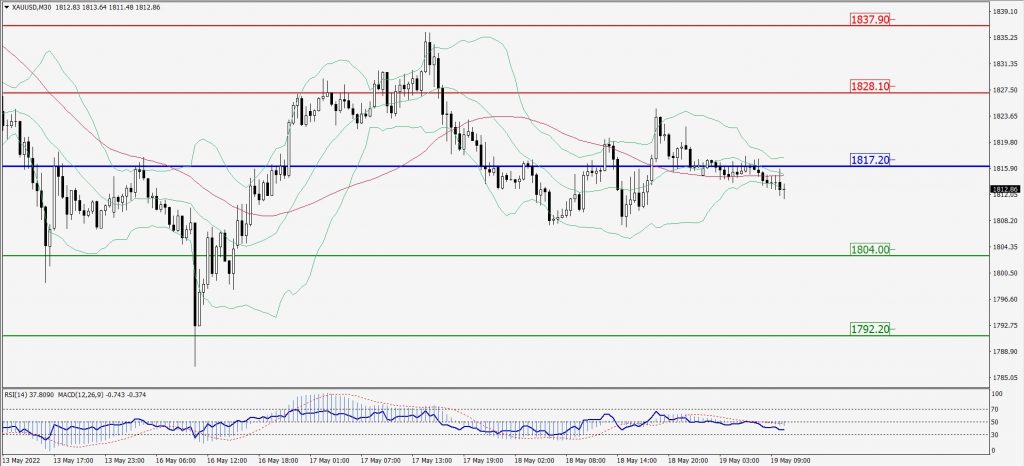
Green Lines Indicate Resistance Levels – Red Lines Indicate Support Levels
Light Blue is a Pivot Point – Black represents the price when the report was produced
Dow Jones Intraday: Trend on The Downside
Our pivot point is 31,579.00
Preferable Price Action: Take Sell positions below pivot with targets at 30,587.00 & 29,760.00.
Alternative Price Action: Above 31,579.00 looks for further upside to 32,557.00 & 33,363.00.
Comment: RSI below 50 levels and Pair below its 20MA & 55MA.
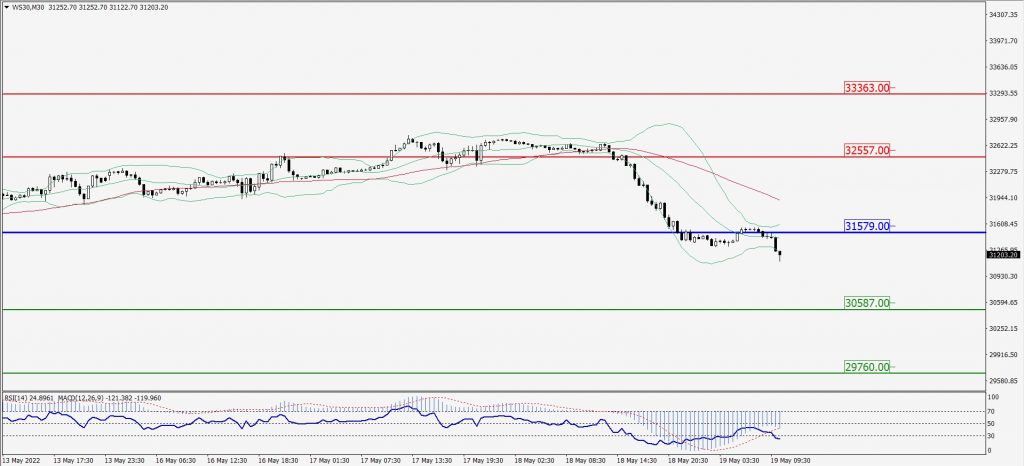
Green Lines Indicate Resistance Levels – Red Lines Indicate Support Levels
Light Blue is a Pivot Point – Black represents the price when the report was produced