Market Wrap: Stocks, Bonds, Commodities
Wall Street finished sharply higher on Tuesday, lifted by Apple, Tesla and other mega-cap growth stocks after strong retail sales in April eased worries about a slowing economic growth.
The S&P 500 gain (2.02%) ended at 4,088.85 points, while the Nasdaq Composite up 2.76% to 11,984.52. The Dow Jones Industrial was rose 1.34% to 32,654.59.
MSCI’s index of Asia-Pacific stocks outside Japan is ascend 0.50% to 652.14 levels. Australian index higher 0.99% to 7,182.70. Japanese Nikkei Index ascend 0.94% to 26,911.20.
European stocks were negative on Wednesday, with the Stoxx Europe 50 Index lose 0.25% to 3,732.25, Germany’s DAX drop 0.11% to 14,168.93, and France’s CAC down 0.26% to 6,413.76, and U.K.’s FTSE 100 decrease 0.06% to 7,513.92.
Benchmark 10-year U.S. Treasury fell as demand for safe assets ascend again, today 10-year bond yields a negative 2.9660.
Oil prices rose more than $1 a barrel in early Asian trade on Wednesday on hopes of demand recovery in China as the country gradually eases some of its strict COVID-19 containment measures.
Spot Brent crude oil rose 1.53% to $113.64 per barrel. US West Texas Intermediate crude is up 1.85% to $111.67 a barrel.
The yellow metal gold is decline 0.27% to 1,814.01 dollars per ounce.
Market Wrap: Forex
The U.S. dollar edged higher in early European trade Wednesday, rebounding after overnight losses, while sterling weakened after U.K. inflation soared in April.
Today, the U.S. dollar index measures the Greenback against a trade-weighted basket of six major currencies, which is a rose of 0.28% to 103.700.
The Euro US Dollar (EUR/USD) is a widely traded pair that is down 0.40% today. This left the pair trading around $1.05050.
The Japanese yen was positive against the U.S. dollar on Wednesday as the stock up. Today USD/JPY is lose 0.13% to 129.220 level.
Another commodity-related currency negative against the U.S dollar, AUD/USD drop 0.36 to 0.70060, and NZD/USD lower 0.19% to 0.63500 level.
EUR/USD Intraday: Trend on The Downside
Our pivot point is at 1.05540
Preferable Price Action: Take sell positions below pivot level with targets at 1.04560 & 1.03820 in extension.
Alternative Price Action: Above pivot looks for a further upside to 1.06490 & 1.07300.
Comment: RSI below 50 levels and Pair below 20MA.
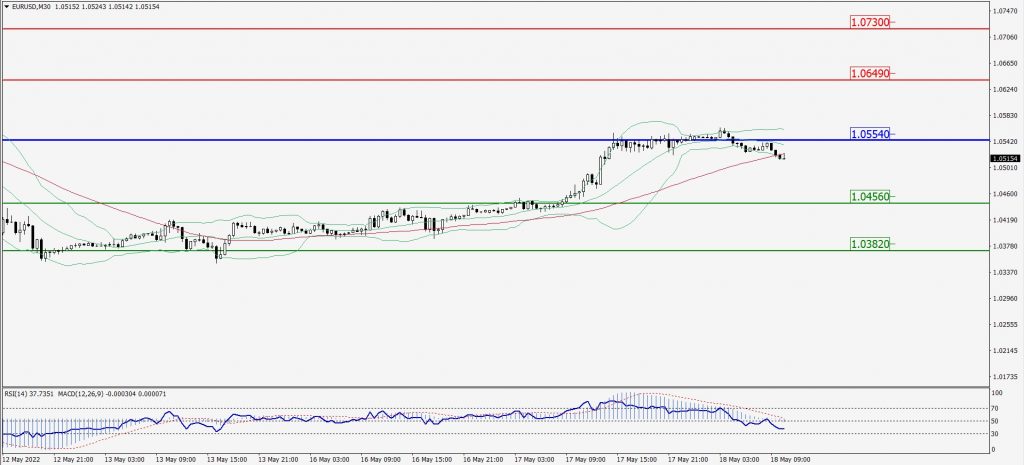
Green Lines Indicate Resistance Levels – Red Lines Indicate Support Levels
Light Blue is a Pivot Point – Black represents the price when the report was produced
GBP/USD Intraday: Major Trend on The Downside
Our pivot point is at 1.24730
Preferable Price Action: Sell positions below pivot with targets at 1.23370 & 1.22370 in extension.
Alternative Price Action: The price above pivot would call for further upside to 1.26210 & 1.27220.
Comment: RSI below 50 levels pair below its 20MA & 55MA.
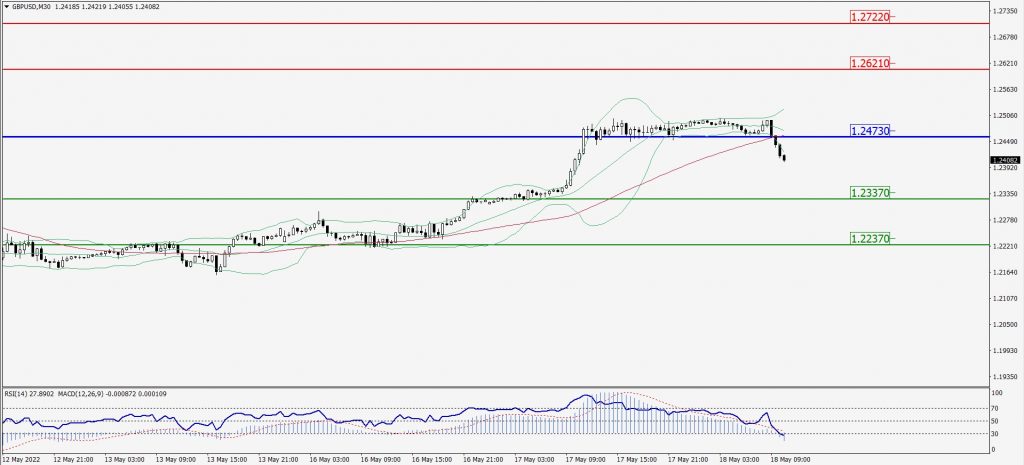
Green Lines Indicate Resistance Levels – Red Lines Indicate Support Levels
Light Blue is a Pivot Point – Black represents the price when the report was produced
USD/JPY Intraday: Major Support Level at 129.100
Our pivot point is at 129.100
Preferable Price Action: Buy position above pivot with the target at 129.700 and 130.130 in extension.
Alternative Price Action: The downside breakout of the pivot would call for 128.570 and 128.160.
Comment: MACD is flat territory.
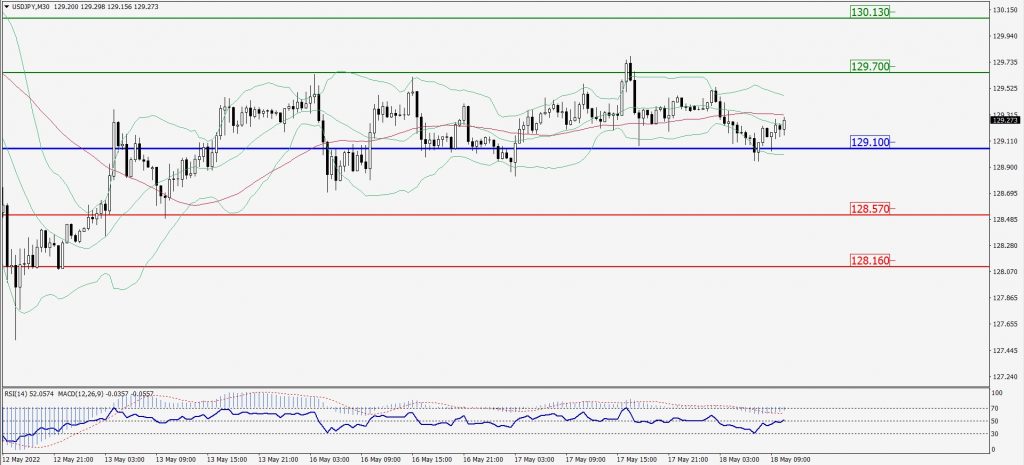
Green Lines Indicate Resistance Levels – Red Lines Indicate Support Levels
Light Blue is a Pivot Point – Black represents the price when the report was produced
AUD/USD Intraday: May Trend Reverse from 0.70400
Our pivot point is at 0.70400
Preferable Price Action: Sell Positions below pivot with targets at 0.69400 & 0.68720 in extension.
Alternative Price Action: Above pivot looks for a further upside with 0.71230 & 0.71850 as targets.
Comment: RSI below 50 levels and Pair below its 20MA & 55MA.
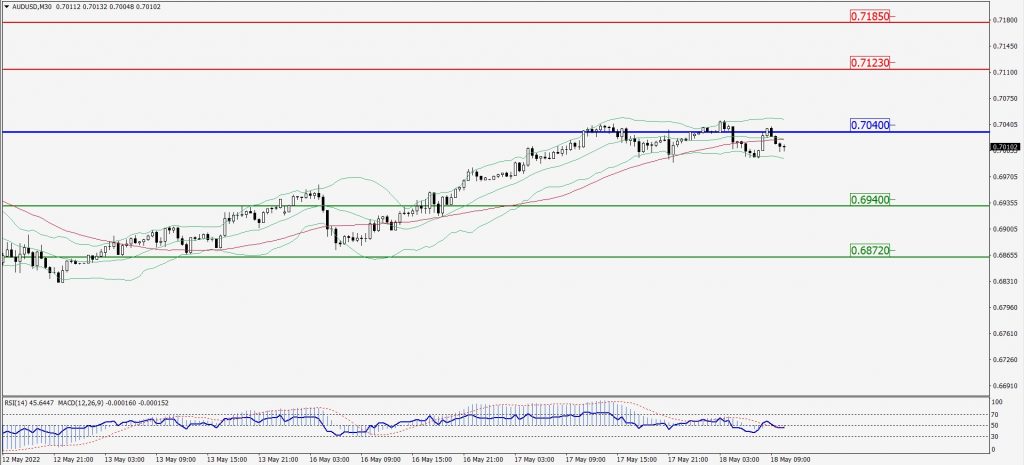
Green Lines Indicate Resistance Levels – Red Lines Indicate Support Levels
Light Blue is a Pivot Point – Black represents the price when the report was produced
CRUDEOIL Intraday: Trend on The Upside
Our pivot point is at 110.36
Preferable Price Action: Above pivots Buy oil with 114.40 & 117.18 as targets.
Alternative Price Action: Sell crude below pivot with targets at 106.69 and 104.03 in extension.
Comment: MACD is in the positive territory and Pair above 20MA.
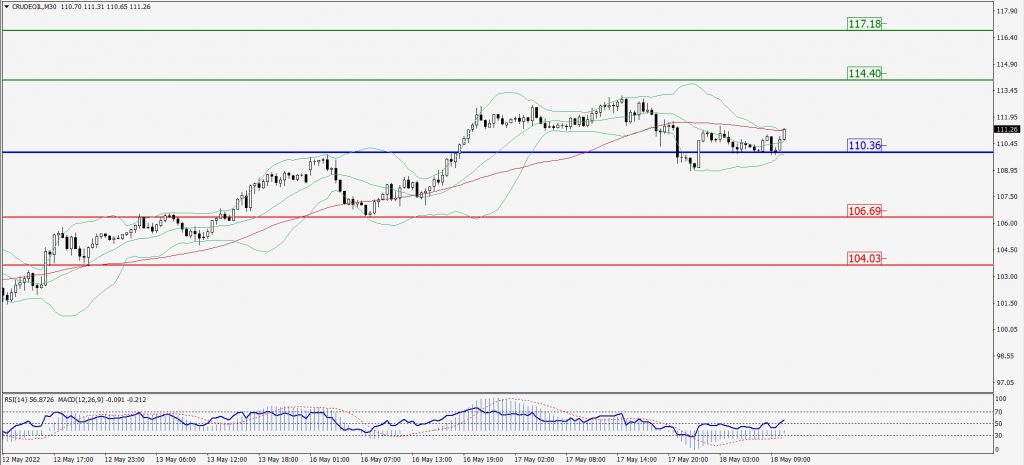
Green Lines Indicate Resistance Levels – Red Lines Indicate Support Levels
Light Blue is a Pivot Point – Black represents the price when the report was produced
XAU/USD Intraday: In a Consolidation Zone
Our pivot point is 1811.00
Preferable Price Action: Further upside to 1833.10 and 1853.30.
Alternative Price Action: If the price gives a downside breakout of a pivot, then the price extends to 1792.60 and 1777.60.
Comment: MACD is positive territory and pair above 20MA.
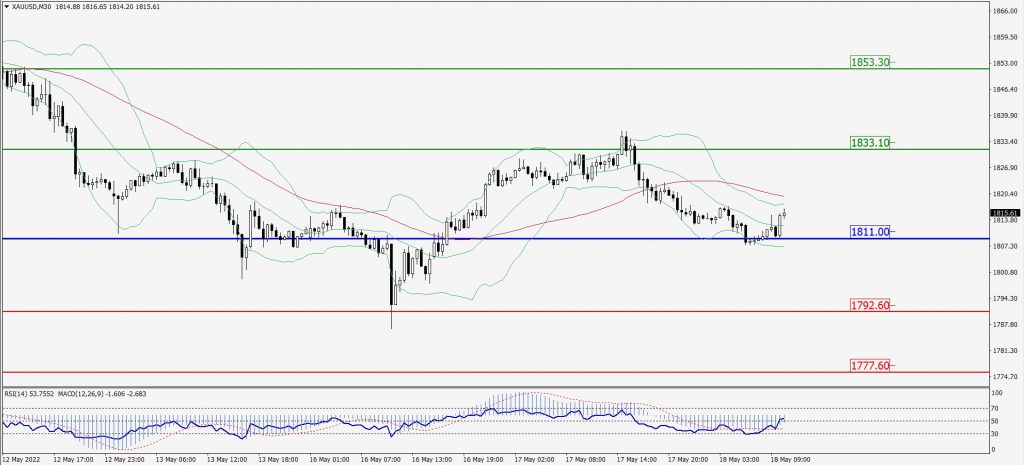
Green Lines Indicate Resistance Levels – Red Lines Indicate Support Levels
Light Blue is a Pivot Point – Black represents the price when the report was produced
Dow Jones Intraday: Trend on The Downside
Our pivot point is 32,772.00
Preferable Price Action: Take Sell positions below pivot with targets at 32,059.00 & 31,489.00.
Alternative Price Action: Above 32,772.00 looks for further upside to 33,468.00 & 33,936.00.
Comment: RSI below 50 levels and Pair below 20MA.
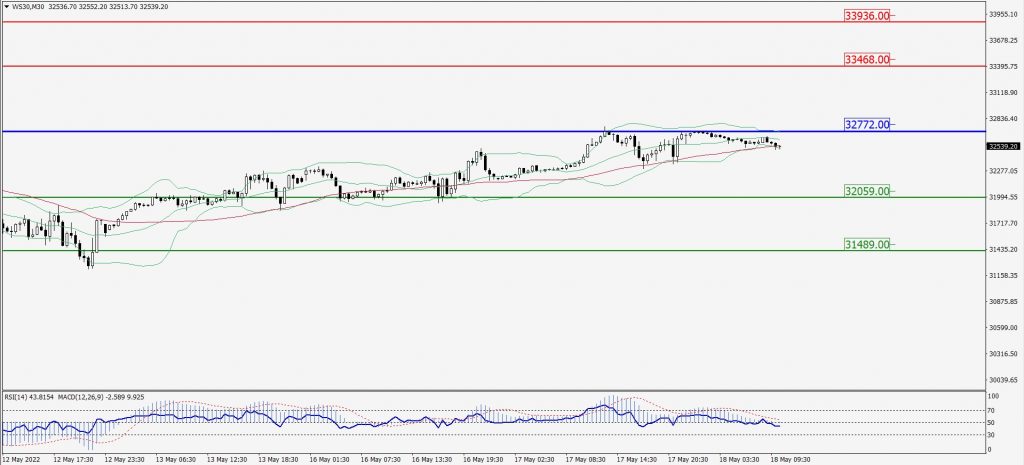
Green Lines Indicate Resistance Levels – Red Lines Indicate Support Levels
Light Blue is a Pivot Point – Black represents the price when the report was produced