Market Wrap: Stocks, Bonds, Commodities
Wall Street ended lower after a volatile session on Thursday, with Cisco Systems slumping after giving a dismal outlook, while investors fretted about inflation and rising interest rates.
The S&P 500 lose (0.58%) ended at 3,900.79 points, while the Nasdaq Composite down 0.26% to 11,388.50. The Dow Jones Industrial was fell 0.75% to 31,253.13.
MSCI’s index of Asia-Pacific stocks outside Japan is ascend 2.26% to 663.06 levels. Australian index higher 1.15% to 7,145.60. Japanese Nikkei Index ascend 1.27% to 26,739.03.
European stocks were positive on Friday, with the Stoxx Europe 50 Index gain 1.10% to 3,680.75, Germany’s DAX advance 1.35% to 14,069.23, and France’s CAC up 0.85% to 6,327.43, and U.K.’s FTSE 100 increase 1.55% to 7,415.74.
Benchmark 10-year U.S. Treasury fell as demand for safe assets ascend again, today 10-year bond yields a positive 2.8710.
Oil prices were little changed on Friday as worries about weaker economic growth offset expectations that crude demand could rebound in China as Shanghai lifts some coronavirus lockdowns.
Spot Brent crude oil fell 0.09% to $111.98 per barrel. US West Texas Intermediate crude is down 0.27% to $109.59 a barrel.
The yellow metal gold is advance 0.09% to 1,843.15 dollars per ounce.
Market Wrap: Forex
The U.S. dollar was headed for its worst week since early February against major peers on Friday, weighed down by a retreat in Treasury yields and fatigue after the currency’s breathless 10%, 14-week surge.
Today, the U.S. dollar index measures the Greenback against a trade-weighted basket of six major currencies, which is a rose of 0.15% to 102.900.
The Euro US Dollar (EUR/USD) is a widely traded pair that is down 0.05% today. This left the pair trading around $1.05820.
The Japanese yen was positive against the U.S. dollar on Friday as the stock up. Today USD/JPY is gain 0.11% to 127.920 level.
Another commodity-related currency positive against the U.S dollar, AUD/USD ascend 0.26 to 0.70650, and NZD/USD higher 0.50% to 0.64100 level.
EUR/USD Intraday: Trend on The Downside
Our pivot point is at 1.06060
Preferable Price Action: Take sell positions below pivot level with targets at 1.04870 & 1.03860 in extension.
Alternative Price Action: Above pivot looks for a further upside to 1.07140 & 1.08000.
Comment: RSI below 50 levels and Pair below 20MA.
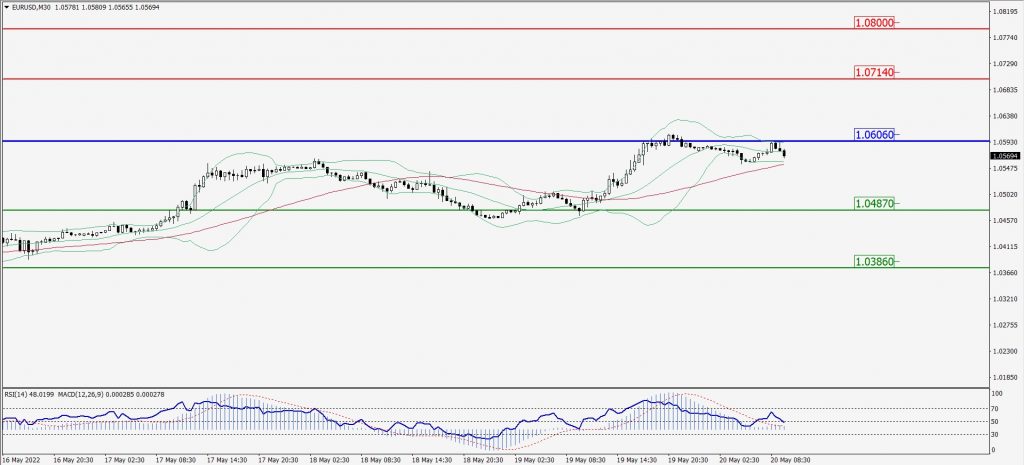
Green Lines Indicate Resistance Levels – Red Lines Indicate Support Levels
Light Blue is a Pivot Point – Black represents the price when the report was produced
GBP/USD Intraday: In a Consolidation Zone
Our pivot point is at 1.24440
Preferable Price Action: Buy positions above pivot with targets at 1.25740 & 1.26690 in extension.
Alternative Price Action: The price below pivot would call for further downside to 1.23280 & 1.22360.
Comment: RSI above 50 levels pair above its 20MA & 55MA.
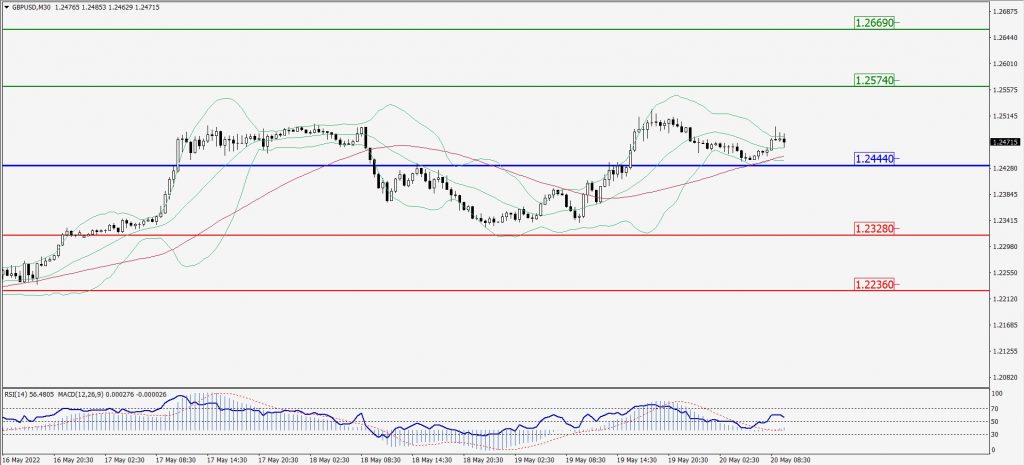
Green Lines Indicate Resistance Levels – Red Lines Indicate Support Levels
Light Blue is a Pivot Point – Black represents the price when the report was produced
USD/JPY Intraday: Major Support Level at 127.640
Our pivot point is at 127.640
Preferable Price Action: Buy position above pivot with the target at 128.730 and 129.600 in extension.
Alternative Price Action: The upside breakout of the pivot would call for 126.670 and 125.810.
Comment: MACD is positive territory.
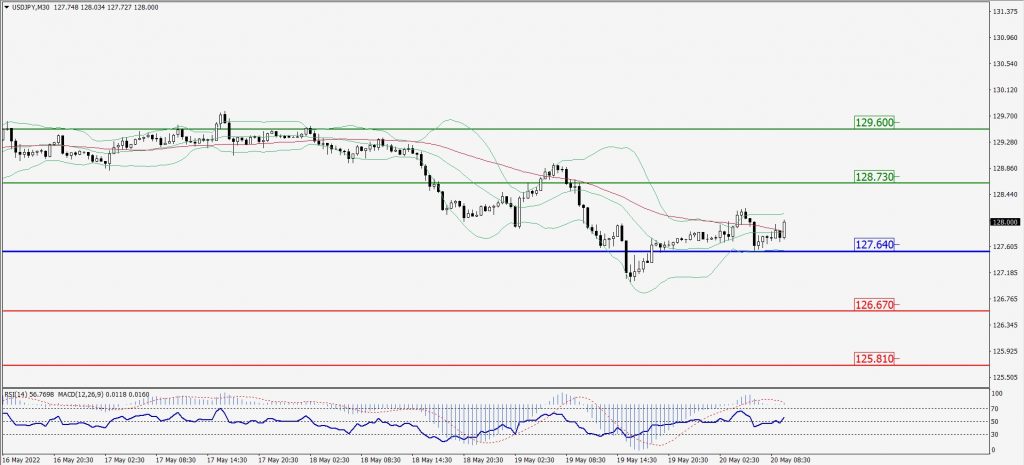
Green Lines Indicate Resistance Levels – Red Lines Indicate Support Levels
Light Blue is a Pivot Point – Black represents the price when the report was produced
AUD/USD Intraday: Trend on The Upside
Our pivot point is at 0.70330
Preferable Price Action: Buy Positions above pivot with targets at 0.71260 & 0.71930 in extension.
Alternative Price Action: Below pivot looks for a further downside with 0.69420 & 0.68670 as targets.
Comment: RSI above 50 levels and Pair above its 20MA & 55MA.
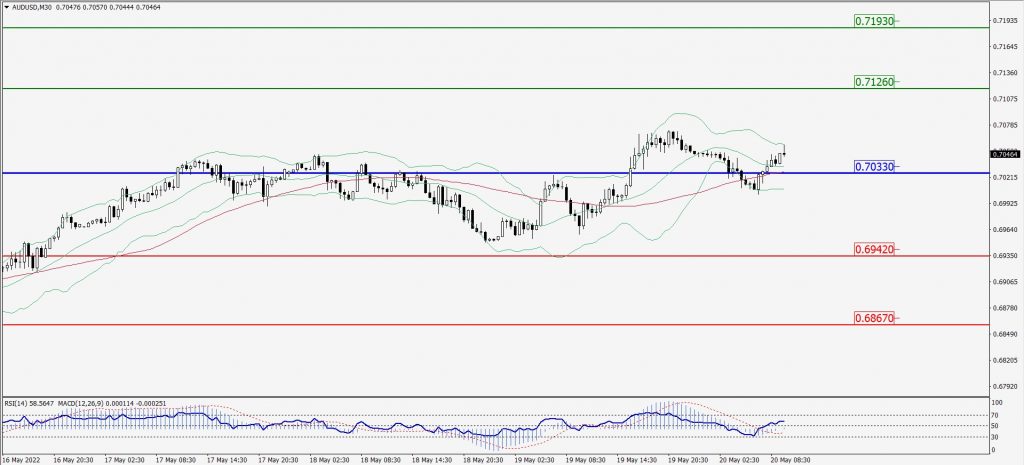
Green Lines Indicate Resistance Levels – Red Lines Indicate Support Levels
Light Blue is a Pivot Point – Black represents the price when the report was produced
CRUDEOIL Intraday: In a Consolidation Zone
Our pivot point is at 107.80
Preferable Price Action: Above pivots buy oil with 111.42 & 113.98 as targets.
Alternative Price Action: Sell crude below pivot with targets at 104.67 and 102.07 in extension.
Comment: MACD is in the positive territory and Pair above 55MA.
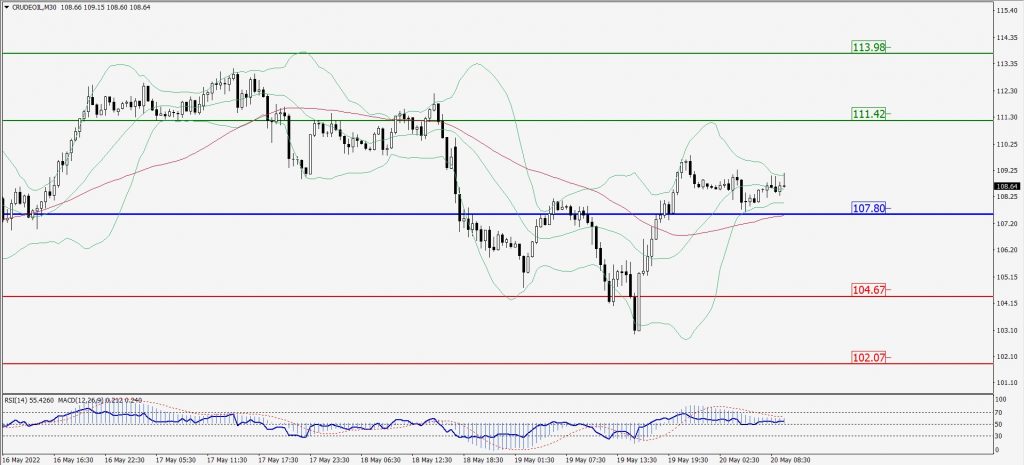
Green Lines Indicate Resistance Levels – Red Lines Indicate Support Levels
Light Blue is a Pivot Point – Black represents the price when the report was produced
XAU/USD Intraday: Major Support Level at 1842.50
Our pivot point is 1842.50
Preferable Price Action: Further upside to 1872.60 and 1893.20.
Alternative Price Action: If the price gives a downside breakout of a pivot, then the price extends to 1816.60 and 1794.50.
Comment: MACD is positive territory and pair above its 20MA & 55MA.
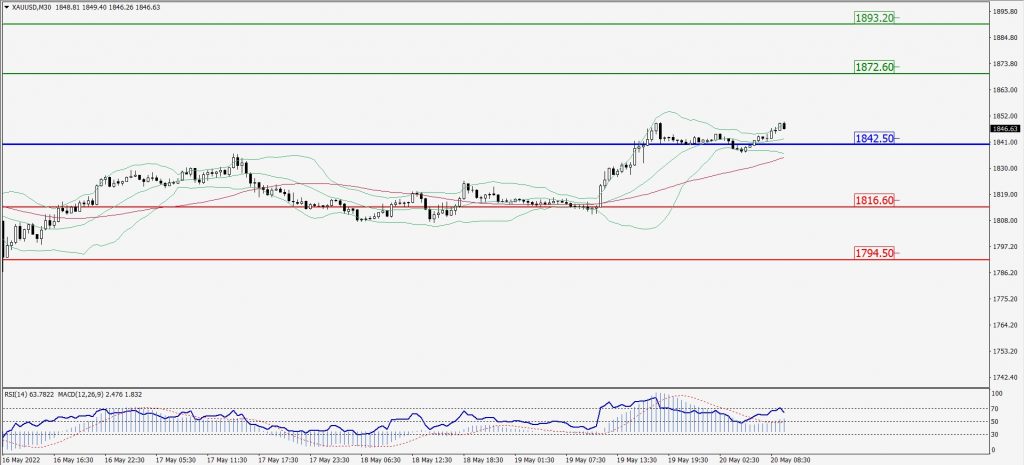
Green Lines Indicate Resistance Levels – Red Lines Indicate Support Levels
Light Blue is a Pivot Point – Black represents the price when the report was produced
Dow Jones Intraday: In a Consolidation Zone
Our pivot point is 31,207.00
Preferable Price Action: Take Buy positions above pivot with targets at 32,142.00 & 33,022.00.
Alternative Price Action: Below 31,207.00 looks for further downside to 30,321.00 & 29,595.00.
Comment: RSI above 50 levels and Pair above 55MA.
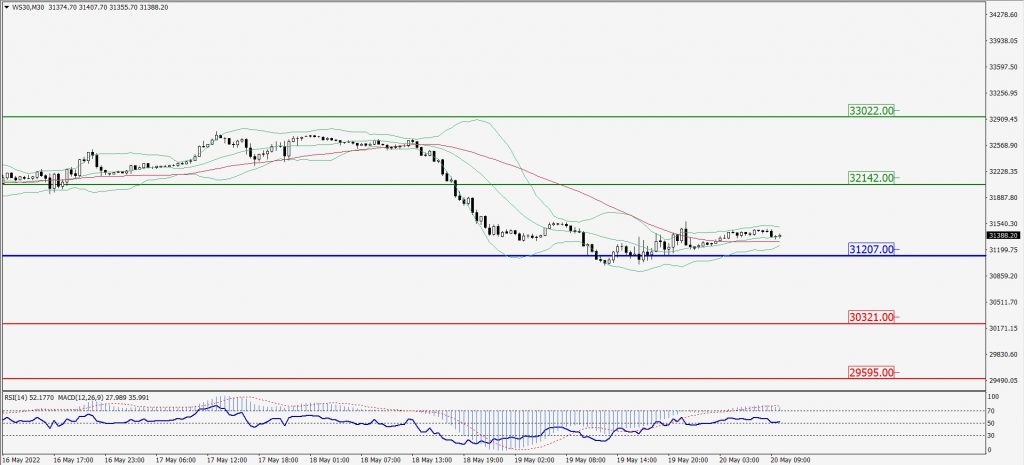
Green Lines Indicate Resistance Levels – Red Lines Indicate Support Levels
Light Blue is a Pivot Point – Black represents the price when the report was produced