Market Wrap: Stocks, Bonds, Commodities
Stock futures inched lower on Thursday night as investors shifted focus from the Federal Reserve policy meeting earlier in the week to the next piece of economic data due Friday morning.
The Dow Jones Industrial Average rose 428.73 points to 34,408.06, the S&P 500 gain 1.22% to 4,425.84 and the Nasdaq Composite add 156.34 points to 13,782.82.
MSCI’s index of Asia-Pacific stocks outside Japan is advance 0.58% to 658.11 levels. The Australian index was higher by 1.06% to 7,251.20. Japanese Nikkei Index advance 0.66% today.
European stocks were positive on Friday, with the Stoxx Europe 50 Index rose 0.38% to 4,381.75, Germany’s DAX advance 0.28% to 16,335.95, and France’s CAC ascend 0.66% to 7,338.74 and U.K.’s FTSE 100 add 0.58% to 7,672.12.
Benchmark 10-year U.S. Treasury fell as demand for safe assets ascend again, today 10-year bond yields positive 0.54% to 3.7460.
Oil prices gained about 3 percent to a one-week high on Thursday on a weaker US dollar and a jump in refinery runs in top crude importer China.
Spot Brent crude oil ascend 0.13% to $75.77 per barrel. US West Texas Intermediate crude is up 0.07% to $70.66 a barrel.
The yellow metal gold is advance 0.18% to 1,974.05 dollars per ounce.
Market Wrap: Forex
The U.S. dollar edged higher in early European trade Friday, rebounding after hefty overnight losses following weak economic data, while the Japanese yen weakened as the Bank of Japan maintained its interest rates at very low levels.
Today, the U.S. dollar index measures the Greenback against a trade-weighted basket of six major currencies, which surged 0.08% to 101.790.
The Euro US Dollar (EUR/USD) is a widely traded pair that is up 0.04% today. This left the pair trading around $1.09490.
The Japanese yen was negative against the U.S. dollar on Friday. Today USD/JPY is surged 0.61% to the 141.130 level.
Another commodity-related currency negative against the U.S dollar, AUD/USD fell 0.09% to 0.68780, and NZD/USD slipped 0.03% to 0.62330 level.
EUR/USD Intraday: Major trend on the upside
Our pivot point is at 1.09420
Preferable Price Action: Take buy positions above pivot level with targets at 1.10100 & 1.10550 in extension.
Alternative Price Action: Below pivot looks for a further downside to 1.08860 & 1.08420.
Comment: RSI is above 50 levels and Pairs above its 20MA & 55MA.
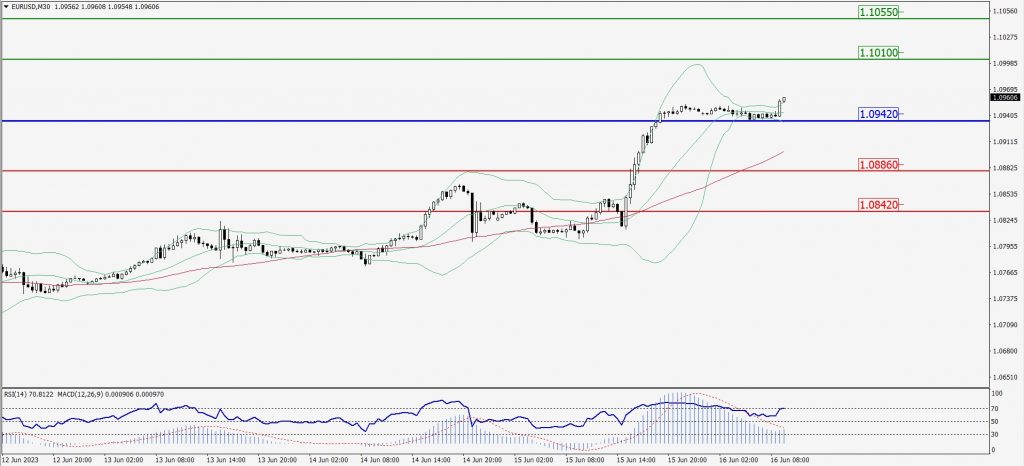
Green Lines Indicate Resistance Levels – Red Lines Indicate Support Levels
Light Blue is a Pivot Point – Black represents the price when the report was produced
GBP/USD Intraday: Major support level at 1.27840
Our pivot point is at 1.27840
Preferable Price Action: Buy positions above pivot with targets at 1.29050 & 1.29790 in extension.
Alternative Price Action: The price below pivot would call for further downside to 1.26800 & 1.26110.
Comment: RSI is above 50 levels and Pairs above its 20MA & 55MA.
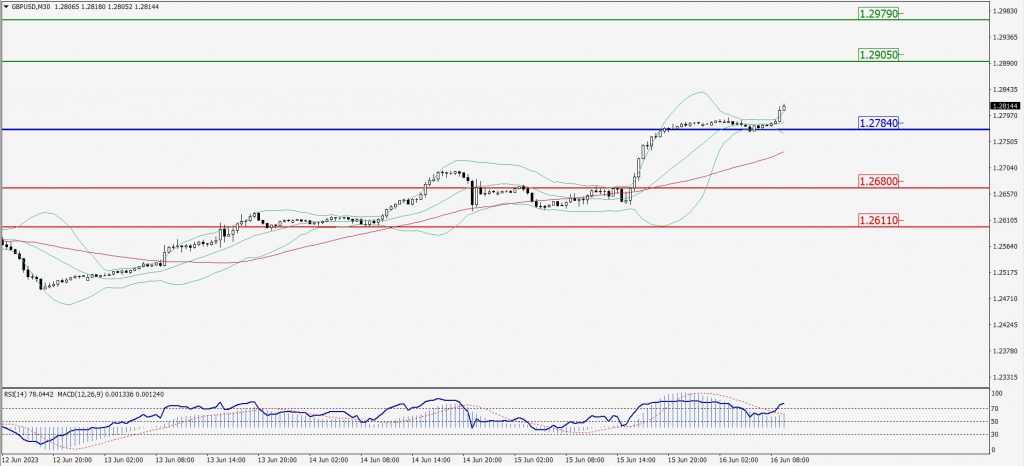
Green Lines Indicate Resistance Levels – Red Lines Indicate Support Levels
Light Blue is a Pivot Point – Black represents the price when the report was produced
USD/JPY Intraday: Trend on the upside
Our pivot point is at 140.600
Preferable Price Action: Buy position above pivot with the target at 141.370 and 141.910 in extension.
Alternative Price Action: The downside breakout of the pivot would call for 140.040 and 139.600.
Comment: MACD is above 50 level and Pairs above its 20MA & 55MA.
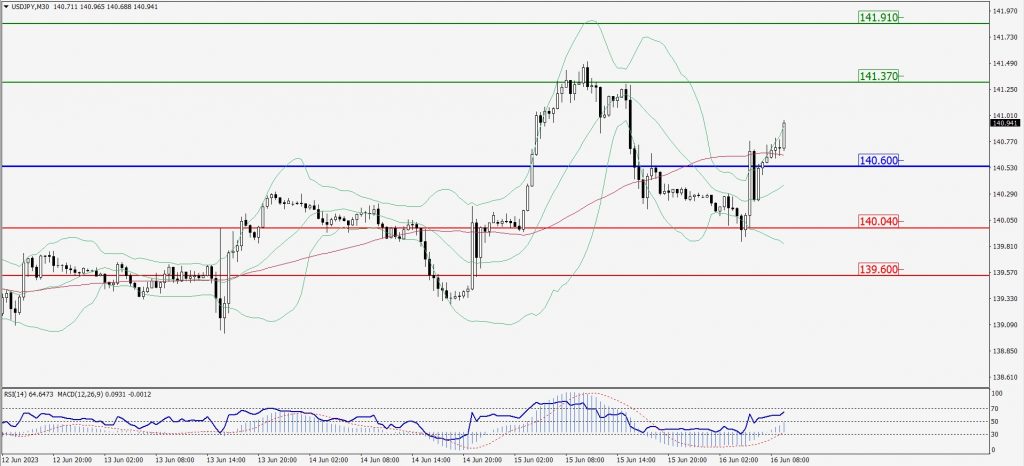
Green Lines Indicate Resistance Levels – Red Lines Indicate Support Levels
Light Blue is a Pivot Point – Black represents the price when the report was produced
AUD/USD Intraday: Trend on the upside
Our pivot point is at 0.68800
Preferable Price Action: Buy positions above pivot with targets at 0.69330 & 0.69680 in extension.
Alternative Price Action: Below pivot looks for a further downside with 0.68360 & 0.68000 as targets.
Comment: RSI is above 50 levels and Pairs above its 20MA & 55MA.
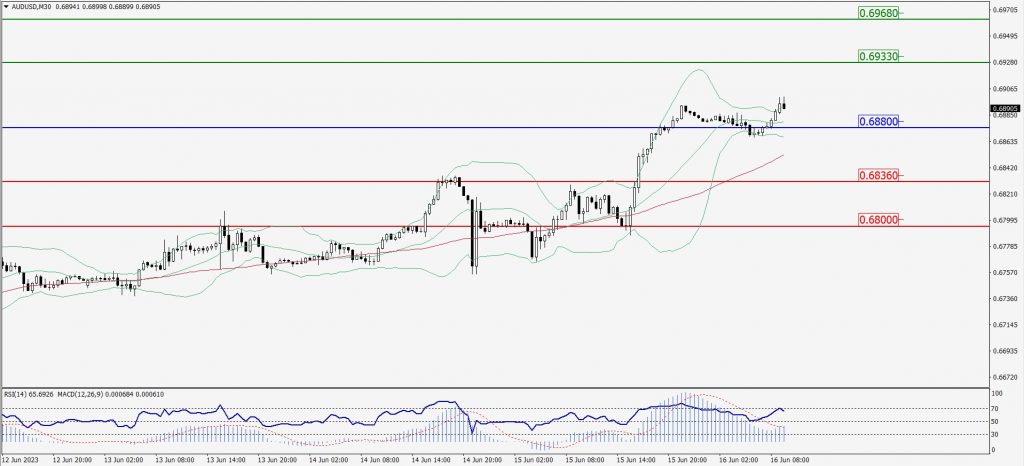
Green Lines Indicate Resistance Levels – Red Lines Indicate Support Levels
Light Blue is a Pivot Point – Black represents the price when the report was produced
CRUDEOIL Intraday: Support level at 70.67
Our pivot point is at 70.67
Preferable Price Action: Above pivot buy oil with 71.64 & 72.24 as targets.
Alternative Price Action: Sell crude below pivot with targets at 69.91 and 69.34 in extension.
Comment: MACD is positive territory and Pairs above its 20MA & 55MA.
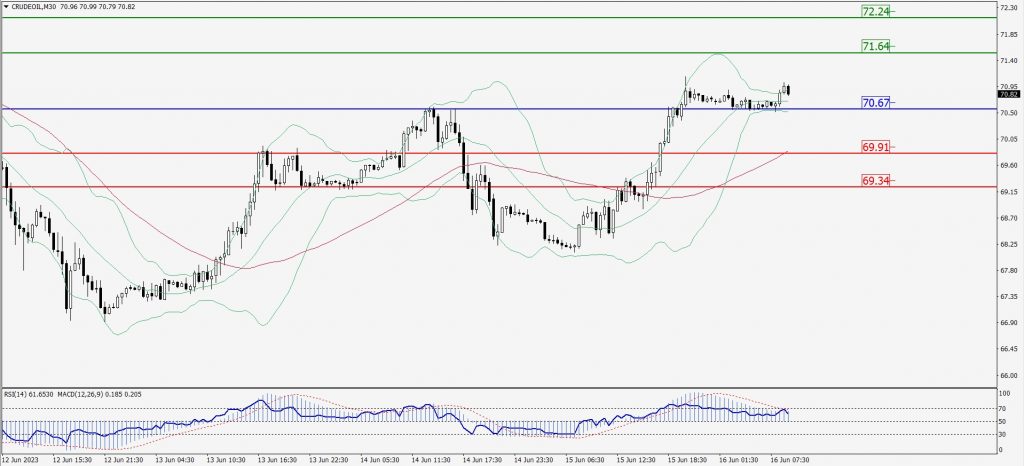
Green Lines Indicate Resistance Levels – Red Lines Indicate Support Levels
Light Blue is a Pivot Point – Black represents the price when the report was produced
XAU/USD Intraday: Support level at 1956.50
Our pivot point is 1956.50
Preferable Price Action: Further upside to 1970.40 and 1979.90
Alternative Price Action: If the price gives a downside breakout of a pivot, then the price extends to 1944.60 and 1935.30.
Comment: MACD is above 50 level and Pairs above its 20MA & 55MA.
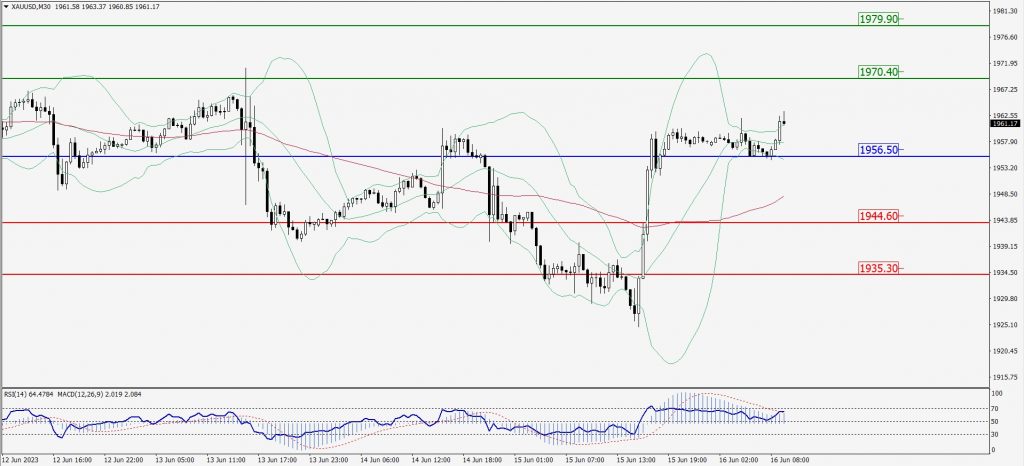
Green Lines Indicate Resistance Levels – Red Lines Indicate Support Levels
Light Blue is a Pivot Point – Black represents the price when the report was produced
Dow Jones Intraday: Trend on the upside
Our pivot point is 34,384.00
Preferable Price Action: Take buy positions above the pivot with targets at 34,568.00 & 34,684.00.
Alternative Price Action: Below 34,384.00 looks for further downside to 34,225.00 & 34,105.00.
Comment: RSI is above 50 levels and Pairs above its 20MA & 55MA.
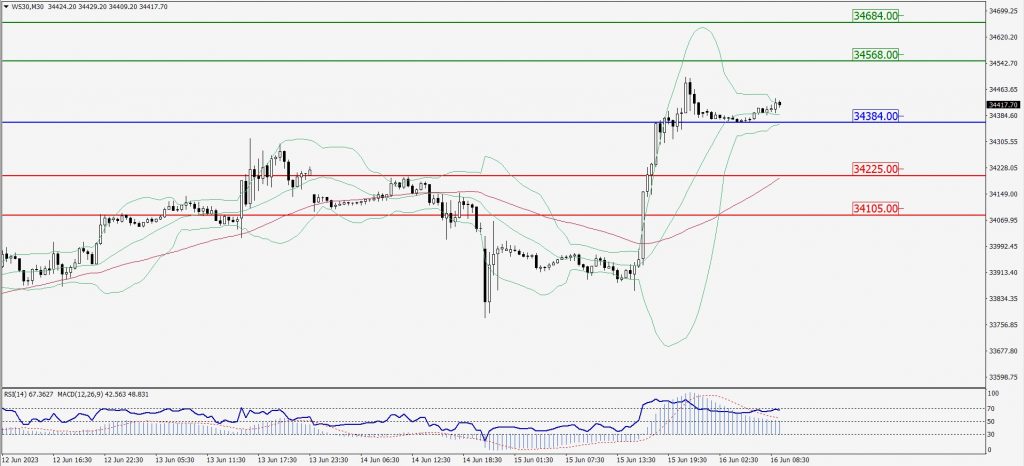
Green Lines Indicate Resistance Levels – Red Lines Indicate Support Levels
Light Blue is a Pivot Point – Black represents the price when the report was produced