Market Wrap: Stocks, Bonds, Commodities
Most Asian currencies tread water on Thursday amid concerns over stricter U.S. trade restrictions on China, while the Japanese yen steadied after strengthening sharply this week on suspected intervention.
The Dow Jones Industrial Average rose 243.60 points to 41,198.08, the S&P 500 loss 1.39% to 5,588.27 and the Nasdaq Composite descend 511.53 points to 17,997.81.
MSCI’s index of Asia-Pacific stocks outside Japan is down 0.45% to 708.27 levels. The Australian index was lower by 0.27% to 8,036.50. Japanese Nikkei Index decrease 2.51% today.
European stocks were positive on Thursday, with the Stoxx Europe 50 Index increase 0.10% to 4,896.35, Germany’s DAX ascend 0.05% to 18,453.15, and France’s CAC higher 0.32% to 7,595.14 and U.K.’s FTSE 100 gain 0.90% to 8,261.00.
Benchmark 10-year U.S. Treasury rose as demand for safe assets slipped again, today 10-year bond yields increase 0.58% to 4.1670.
Oil prices extended gains on Thursday, buoyed by a bigger than expected decline in crude stocks in the United States, the world’s largest oil consumer.
Spot Brent crude oil increase 0.67% to $85.65 per barrel. US West Texas Intermediate crude is increase 0.83% to $82.12 a barrel.
The yellow metal gold is up 0.65% to 2,475.80 dollars per ounce.
Market Wrap: Forex
Japan’s yen scaled a six-week high on Thursday, spurring speculation of an official push, while traders waited on a European Central Bank meeting to direct the euro’s next move.
Today, the U.S. dollar index measures the Greenback against a trade-weighted basket of six major currencies, which increase 0.06% to 103.5070.
The Euro US Dollar (EUR/USD) is a widely traded pair that is descend 0.08% today. This left the pair trading around $1.09280.
The Japanese yen was will move negative against the U.S. dollar on Thursday. Today USD/JPY is trades pair that decrease 0.04% to the 156.100 level.
Another commodity-related currency mixed against the U.S dollar, AUD/USD rose 0.16% to 0.67380, and NZD/USD decrease 0.03% to 0.60700 level.
EUR/USD Intraday: Trend on the downside
Our pivot point is at 1.09340
Preferable Price Action: Take sell positions below pivot level with targets at 1.09250 & 1.09180 in extension.
Alternative Price Action: Buy pivot looks for a further upside to 1.09430 & 1.09500.
Comment: RSI is below 50 levels and Pairs below its 20MA.
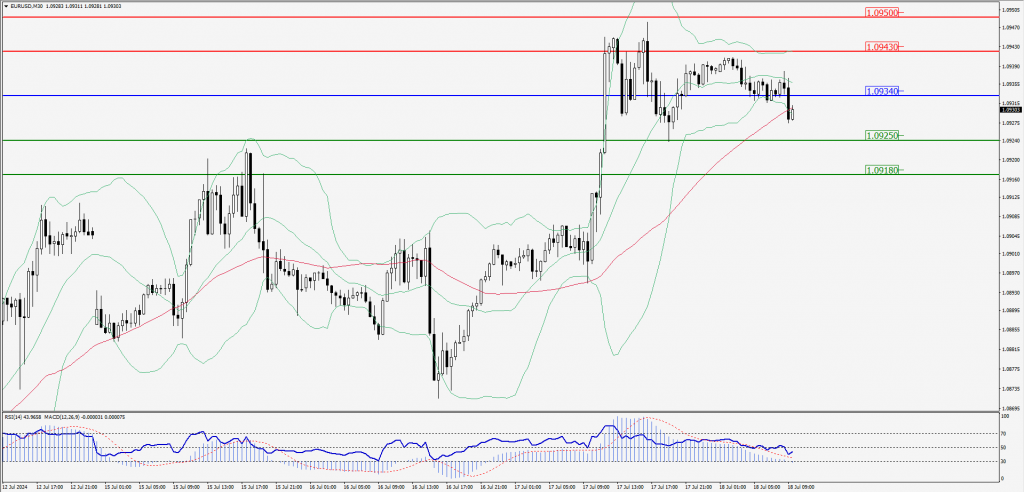
Green Lines Indicate Resistance Levels – Red Lines Indicate Support Levels
Light Blue is a Pivot Point – Black represents the price when the report was produced
GBP/USD Intraday: Trend on the downside
Our pivot point is at 1.29940
Preferable Price Action: Sell positions below pivot with targets at 1.29780 & 1.29620 in extension.
Alternative Price Action: The price above pivot would call for further upside to 1.30110 & 1.30260.
Comment: RSI is below 50 levels and Pairs below its 55MA & 20MA.
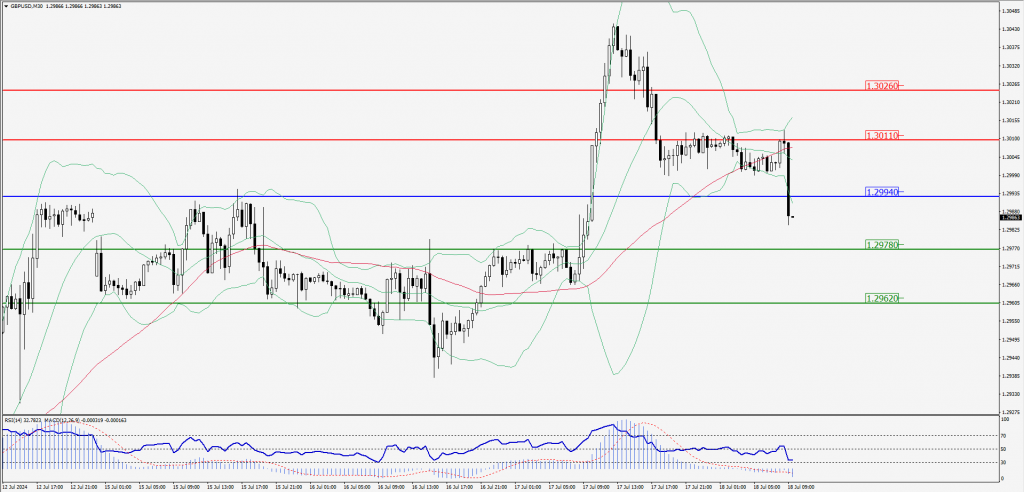
Green Lines Indicate Resistance Levels – Red Lines Indicate Support Levels
Light Blue is a Pivot Point – Black represents the price when the report was produced
USD/JPY Intraday: Trend on the downside
Our pivot point is at 156.460
Preferable Price Action: Sell position below pivot with the target at 155.900 and 155.370 in extension.
Alternative Price Action: The upside breakout of the pivot would call for 157.020 and 157.590.
Comment: MACD is below 50 levels Pairs below its 55MA.
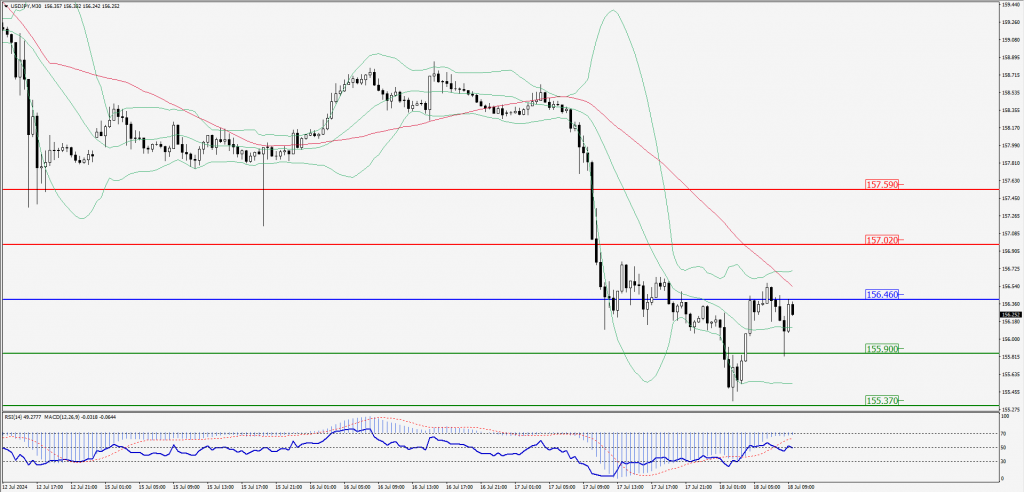
Green Lines Indicate Resistance Levels – Red Lines Indicate Support Levels
Light Blue is a Pivot Point – Black represents the price when the report was produced
AUD/USD Intraday: Support level at 0.67350
Our pivot point is at 0.67350
Preferable Price Action: Buy positions above pivot with targets at 0.67460 & 0.67560 in extension.
Alternative Price Action: Below pivot a further downside with 0.67240 & 0.67140 as targets.
Comment: RSI is above 50 levels and Pairs above its 55MA & 20MA.
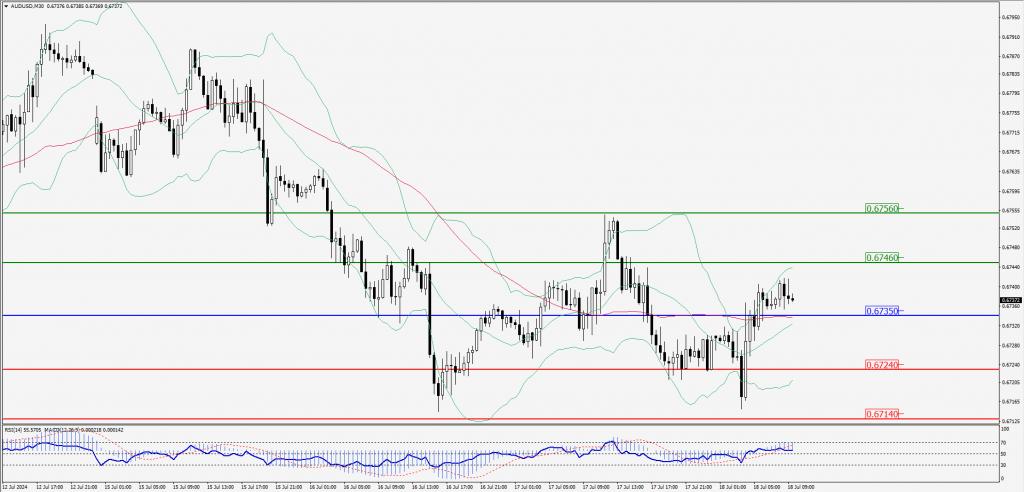
Green Lines Indicate Resistance Levels – Red Lines Indicate Support Levels
Light Blue is a Pivot Point – Black represents the price when the report was produced
CRUDEOIL Intraday: Major trend on the upside
Our pivot point is at 81.98
Preferable Price Action: Above pivot buy oil with 82.39 & 82.76 as targets.
Alternative Price Action: Sell crude below pivot with targets at 81.59 and 81.22 in extension.
Comment: RSI is above 50 levels and pairs above its 20MA & 55MA.
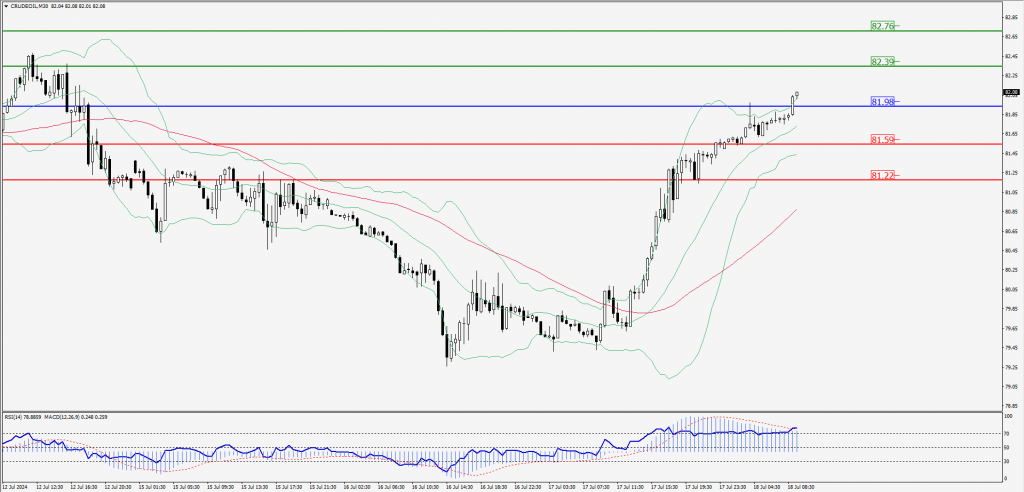
Green Lines Indicate Resistance Levels – Red Lines Indicate Support Levels
Light Blue is a Pivot Point – Black represents the price when the report was produced
XAU/USD Intraday: Trend on the upside
Our pivot point is 2467.20
Preferable Price Action: Further upside to 2477.40 and 2486.70.
Alternative Price Action: If the price gives an downside breakout of a pivot, then the price extends to 2456.70 and 2447.00.
Comment: MACD is above 50 levels and Pairs above its 55MA & 20MA.
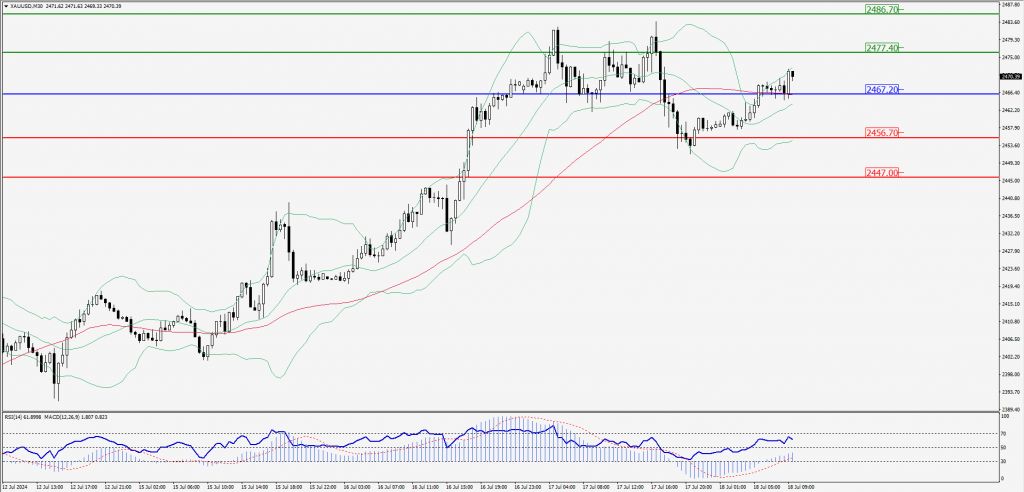
Green Lines Indicate Resistance Levels – Red Lines Indicate Support Levels
Light Blue is a Pivot Point – Black represents the price when the report was produced
Dow Jones Intraday: Trend on the upside
Our pivot point is 41,205.10
Preferable Price Action: Take buy positions above the pivot with targets at 41,412.40 & 41,571.40.
Alternative Price Action: Below 41,205.10 looks for further downside to 41,006.40 & 40,844.60.
Comment: RSI is above 50 levels and pairs above its 55MA.
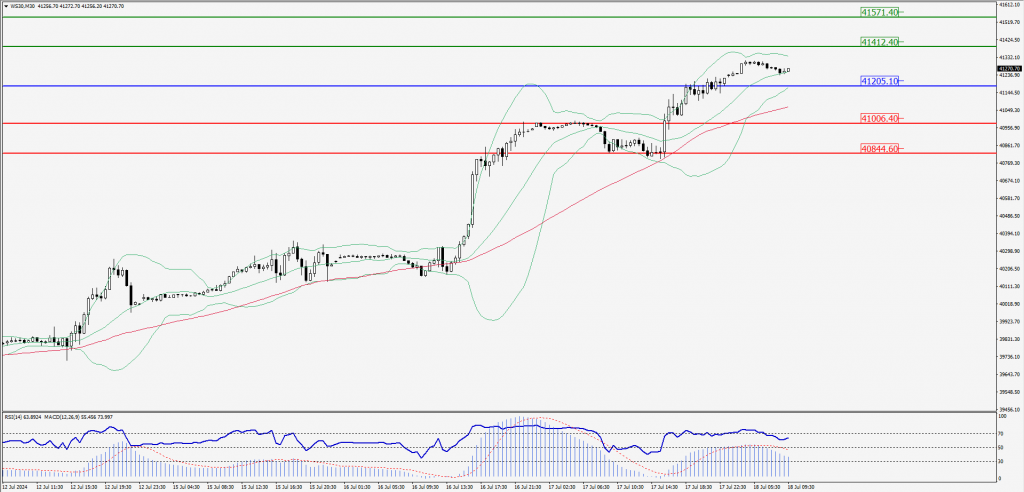
Green Lines Indicate Resistance Levels – Red Lines Indicate Support Levels
Light Blue is a Pivot Point – Black represents the price when the report was produced