Market Wrap: Stocks, Bonds, Commodities
Wall Street’s main indexes slid on Wednesday, with the S&P 500 falling over 1%, after the release of minutes from the Federal Reserve’s policy meeting last month showed officials felt the employment benchmark for decreasing support for the economy could be reached this year.
The Dow Jones Industrial Average fell 382.60 points (1.08%) to 34,960.69, S&P 500 index lost 47.81 points (1.07%) to 4,400.27, and the Nasdaq Composite dropped 130.30 points (0.89%) to 14,525.90.
Asian stocks slumped to their lowest levels this year and the dollar hit 10-month highs on Thursday as a double-whammy of worries about global growth and an end to central bank support drove nervous investors toward safety.
MSCI’s index of Asia-Pacific stocks outside Japan slumped 2.06% to 792.64 levels. Australian index lost 0.50% to 7,464.60. Japanese Nikkei traded 1.10% lower to 27,281.17.
European stocks were lower on Thursday, with the Stoxx Europe 50 Index decline 1.46% to 4,128.85, Germany’s DAX fell 1.25% to 15,766.65, and France’s CAC down 2.01% to 6,632.33, and U.K.’s FTSE 100 lost 1.72% to 7,048.35.
Benchmark 10-year U.S. Treasury rose as demand for safe assets grows again, today 10-year bond yields plunged 2.99% to 1.235.
Oil prices fell for the sixth day, the longest losing streak since February 2020, as a spike in COVID-19 cases worldwide fuelled fears over slower fuel demand while a surprise build in U.S. gasoline inventories added to the pressure.
Spot Brent crude oil fell 2.44% to $66.88 per barrel. US West Texas Intermediate crude slipped 2.44% to $63.62 a barrel.
The yellow metal traded 0.15% lower to 1782.05 dollars per ounce.
Market Wrap: Forex
The dollar index advances to a nine-month high against its major peers on Thursday, on expectations that the Federal Reserve will start tapering its huge stimulus this year.
Today, the U.S. dollar index measures the greenback against a trade-weighted basket of six major currencies, which gained 0.32% to 93.453.
The Euro US Dollar (EUR/USD) is a widely traded pair that fell 0.28% today. This left the pairing trading around $1.16750.
The Japanese yen lost against the U.S. dollar on Thursday as the stock pushes higher. Today US/JPY gained 0.07% to 109.810 level.
Another commodity-related currency lower against the U.S dollar, AUD/USD down 0.91% to 0.71660, and NZD/USD slipped 0.76% to 0.68320 level.
EUR/USD Intraday: Resistance at 1.16980
Our pivot point is at 1.16980
Preferable Price Action: Take short positions below pivot level with targets at 1.16480 & 1.16190 in extension.
Alternative Price Action: Above pivot looks for a further upside to 1.17470 & 1.17740.
Comment: Pair below its 55MA & 20MA and RSI below 50 levels.
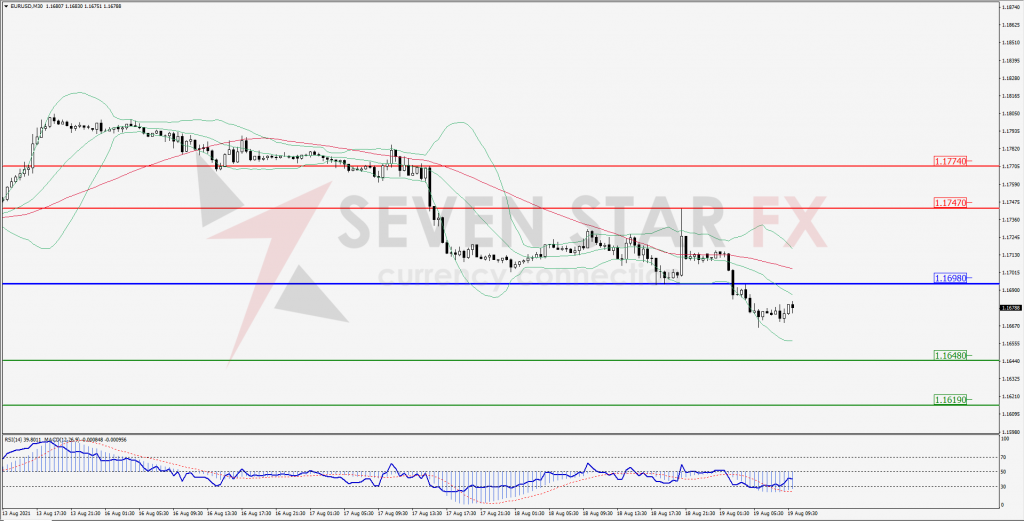
Green Lines Indicate Resistance Levels – Red Lines Indicates Support Levels
Light Blue is a Pivot Point – Black represents the price when the report was produced
GBP/USD Intraday: Break support level
Our pivot point is at 1.37330
Preferable Price Action: Sell positions below pivot with targets at 1.36700 & 1.36360 in extension.
Alternative Price Action: The price above pivot would call for further upside to 1.37950 & 1.38310.
Comment: Price below its 55MA & 20MA and RSI at oversold levels.
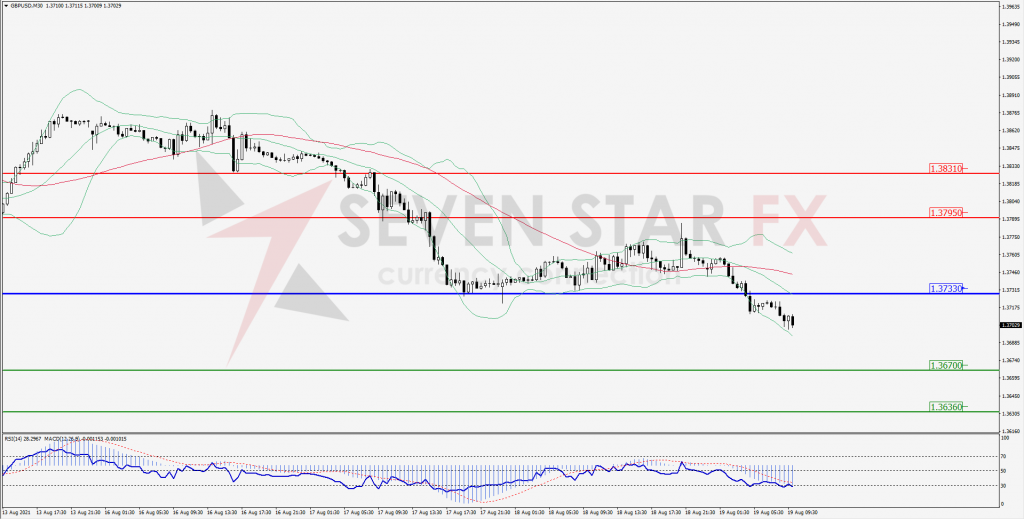
Green Lines Indicate Resistance Levels – Red Lines Indicates Support Levels
Light Blue is a Pivot Point – Black represents the price when the report was produced
USD/JPY Intraday: Resistance at 110.080
Our pivot point is at 110.080
Preferable Price Action: Sell position below pivot with the target at 109.560 and 109.210 in extension.
Alternative Price Action: The upside breakout of the pivot would call for 110.630 and 110.950.
Comment: Price below its 20MA & 55MA and MACD in positive territory.
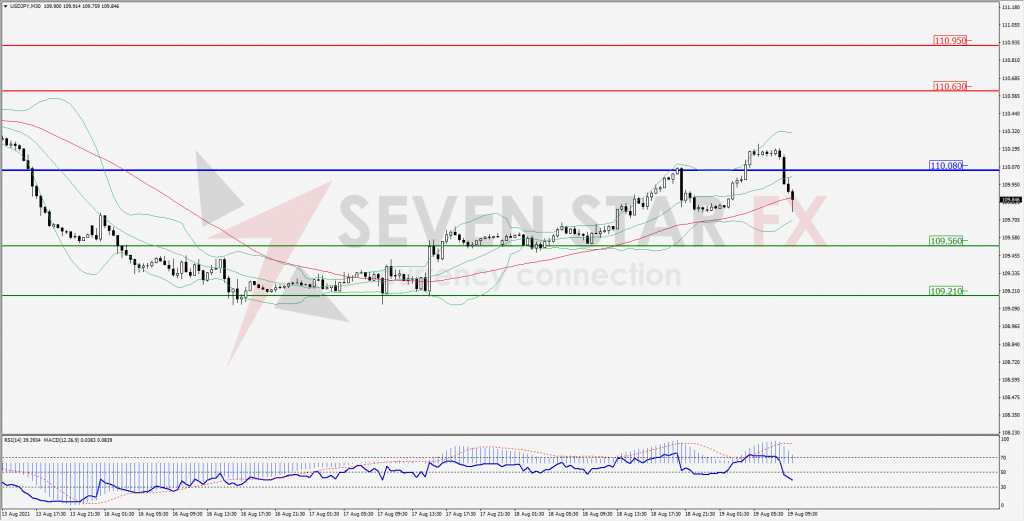
Green Lines Indicate Resistance Levels – Red Lines Indicates Support Levels
Light Blue is a Pivot Point – Black represents the price when the report was produced
AUD/USD Intraday: Trend on the downside
Our pivot point is at 0.72250
Preferable Price Action: Sell Positions below pivot with targets at 0.71510 & 0.71150 in extension.
Alternative Price Action: Above pivot looks for a further upside with 0.72980 & 0.73360 as targets.
Comment: Pair below its 20MA & 55MA and RSI at oversold levels.
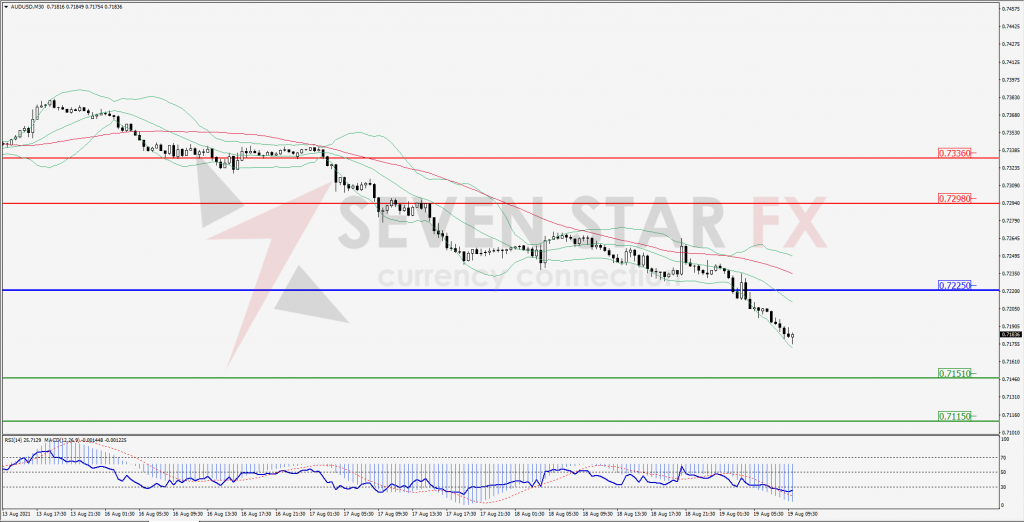
Green Lines Indicate Resistance Levels – Red Lines Indicates Support Levels
Light Blue is a Pivot Point – Black represents the price when the report was produced
CRUDEOIL Intraday: Trend on the downside
Our pivot point is at 64.78
Preferable Price Action: Below pivots sell Oil with 62.59 & 61.50 as targets.
Alternative Price Action: Buy crude above pivot with targets at 66.74 and 67.87 in extension.
Comment: Crude is below its 55MA & 20MA and MACD in the negative territory.
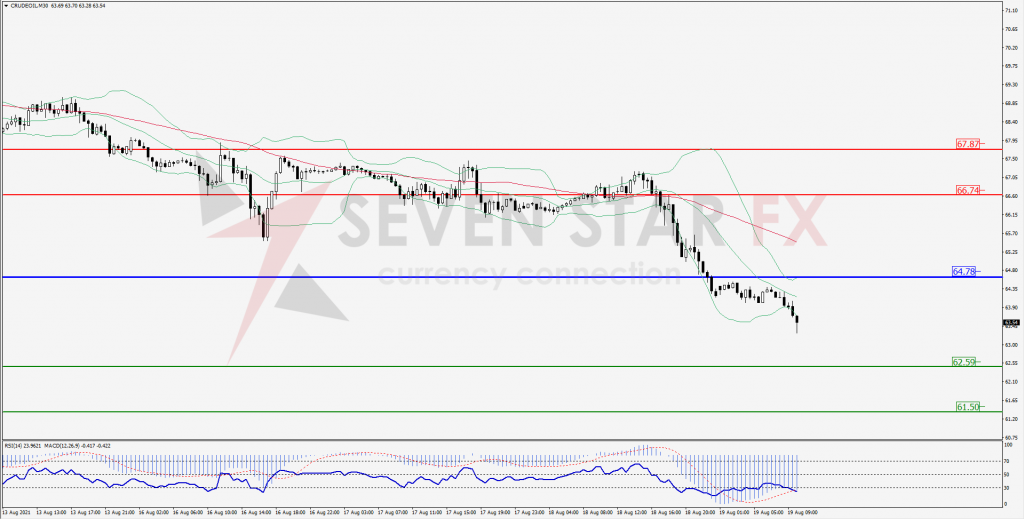
Green Lines Indicate Resistance Levels – Red Lines Indicates Support Levels
Light Blue is a Pivot Point – Black represents the price when the report was produced
XAU/USD Intraday: Resistance at 1790.30
Our pivot point is 1790.30
Preferable Price Action: Further downside to 1772.10 & 1761.30.
Alternative Price Action: If the price gives a upside breakout of a pivot, then the price extends to 1808.60 and 1818.90.
Comment: MACD in negative territory and price below its 55MA & 20MA.
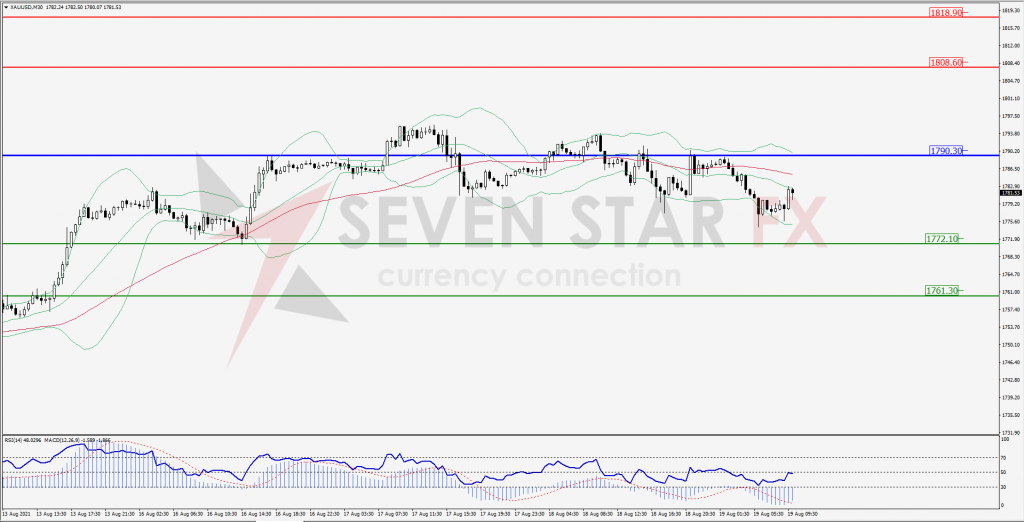
Green Lines Indicate Resistance Levels – Red Lines Indicates Support Levels
Light Blue is a Pivot Point – Black represents the price when the report was produced
Dow Jones Intraday: Strong trend on the downside
Our pivot point is 34,936.00
Preferable Price Action: Take short positions below pivot with targets at 34,586.00 & 34,357.00.
Alternative Price Action: above 35,244.00 looks for further upside to 35,329.00 & 35,565.00.
Comment: Price below its 20MA & 55MA and RSI at oversold levels.
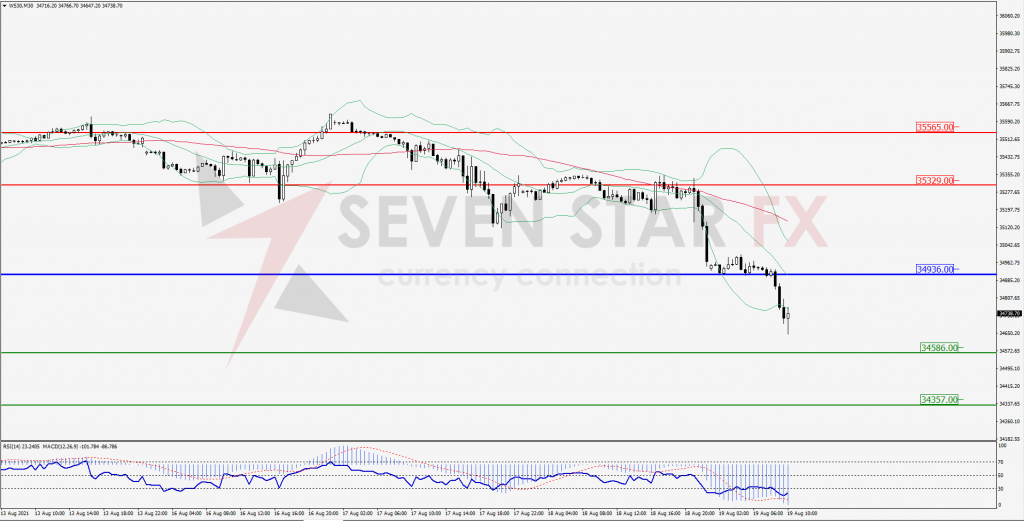
Green Lines Indicate Resistance Levels – Red Lines Indicates Support Levels
Light Blue is a Pivot Point – Black represents the price when the report was produced