Market Wrap: Stocks, Bonds, Commodities
The S&P 500 ended modestly higher in a choppy session on Thursday with gains in tech shares countering losses in cyclical sectors, as investors took the pulse of the economic rebound and gauged when the Federal Reserve might temper its monetary stimulus.
The Dow Jones Industrial Average fell 66.57 points (0.19%) to 34,894.12, the S&P 500 gained 5.53 points (0.13%) to 4,405.8 and the Nasdaq Composite added 15.87 points (0.11%) to 14,541.79.
Asian shares finished the week heading for their lowest close since November and worst week since February, dragged down by losses in China and extending the sharp fall a day earlier.
MSCI’s index of Asia-Pacific stocks outside Japan slumped 1.21% to 781.81 levels. Australian index lost 0.05% to 7,460.90. Japanese Nikkei traded 0.98% lower to 27,013.25.
European stocks were lower on Friday, with the Stoxx Europe 50 Index decline 0.37% to 4,109.18, Germany’s DAX fell 0.60% to 15,670.50, and France’s CAC down 0.51% to 6,570.50, and U.K.’s FTSE 100 lost 0.23% to 7,041.45.
Benchmark 10-year U.S. Treasury rose as demand for safe assets grows again, today 10-year bond yields plunged 1.10% to 1.228.
Oil prices rose on Friday, pulling up from three-month lows, but they were still on track for a weekly loss of over 5% as new lockdowns in countries facing surging cases of the Delta variant dampened the outlook for fuel demand.
Spot Brent crude oil fell 0.27% to $66.27 per barrel. US West Texas Intermediate crude slipped 0.17% to $63.39 a barrel.
The yellow metal traded 0.38% higher to 1789.90 dollars per ounce.
Market Wrap: Forex
The safe-haven U.S. dollar marked a fresh 9-month high against major peers on Friday, buoyed by fears that the Delta coronavirus variant could delay the global economic recovery.
Today, the U.S. dollar index measures the greenback against a trade-weighted basket of six major currencies, which flat to 93.593.
The Euro US Dollar (EUR/USD) is a widely traded pair that fell 0.10% today. This left the pairing trading around $1.16840.
The Japanese yen gained against the U.S. dollar on Friday as the stock pushes higher. Today US/JPY lost 0.12% to 109.580 level.
Another commodity-related currency lower against the U.S dollar, AUD/USD down 0.43% to 0.71130, and NZD/USD slipped 0.48% to 0.68080 level.
EUR/USD Intraday: Resistance at 1.17060
Our pivot point is at 1.17060
Preferable Price Action: Take short positions below pivot level with targets at 1.16610 & 1.16320 in extension.
Alternative Price Action: Above pivot looks for a further upside to 1.17480 & 1.17730.
Comment: Pair below its 55MA & 20MA and RSI below 50 levels.
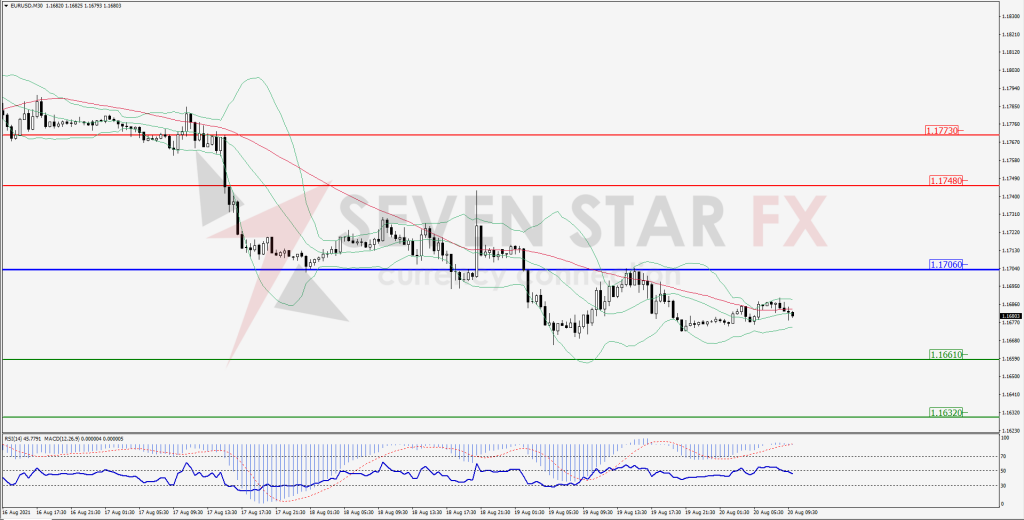
Green Lines Indicate Resistance Levels – Red Lines Indicates Support Levels
Light Blue is a Pivot Point – Black represents the price when the report was produced
GBP/USD Intraday: Trend on the downside
Our pivot point is at 1.36850
Preferable Price Action: Sell positions below pivot with targets at 1.35960 & 1.35410 in extension.
Alternative Price Action: The price above pivot would call for further upside to 1.37670 & 1.38250.
Comment: Price below its 55MA & 20MA and RSI at oversold levels.
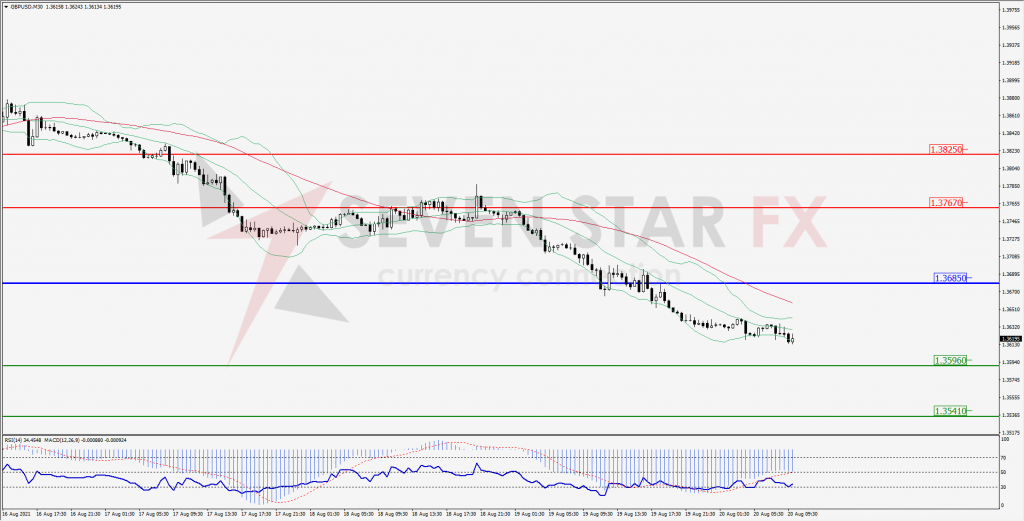
Green Lines Indicate Resistance Levels – Red Lines Indicates Support Levels
Light Blue is a Pivot Point – Black represents the price when the report was produced
USD/JPY Intraday: Resistance at 109.870
Our pivot point is at 109.870
Preferable Price Action: Sell position below pivot with the target at 109.420 and 109.140 in extension.
Alternative Price Action: The upside breakout of the pivot would call for 110.310 and 110.590.
Comment: Price below its 20MA & 55MA and MACD in positive territory.
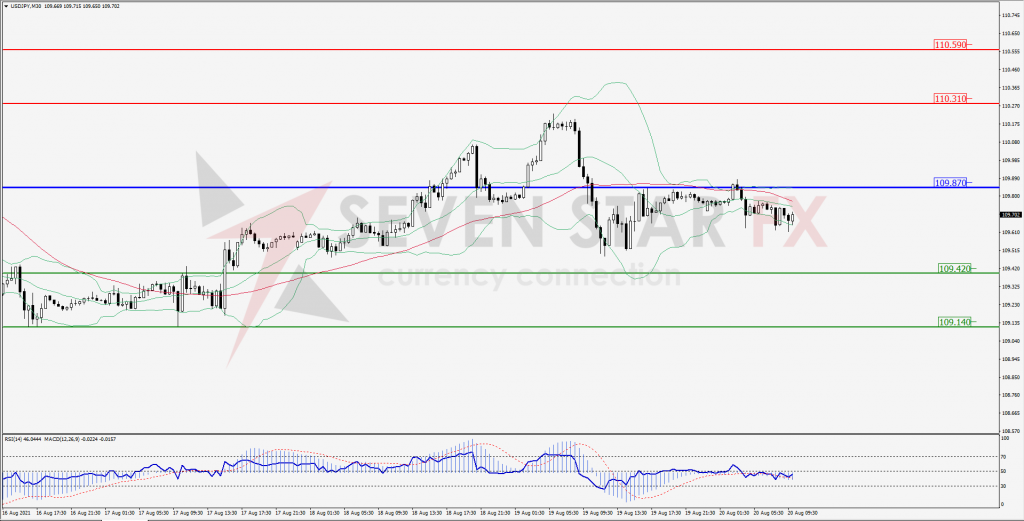
Green Lines Indicate Resistance Levels – Red Lines Indicates Support Levels
Light Blue is a Pivot Point – Black represents the price when the report was produced
AUD/USD Intraday: Trend on the downside
Our pivot point is at 0.71700
Preferable Price Action: Sell Positions below pivot with targets at 0.70950 & 0.70570 in extension.
Alternative Price Action: Above pivot looks for a further upside with 0.72450 & 0.72870 as targets.
Comment: Pair below its 20MA & 55MA and RSI at oversold levels.
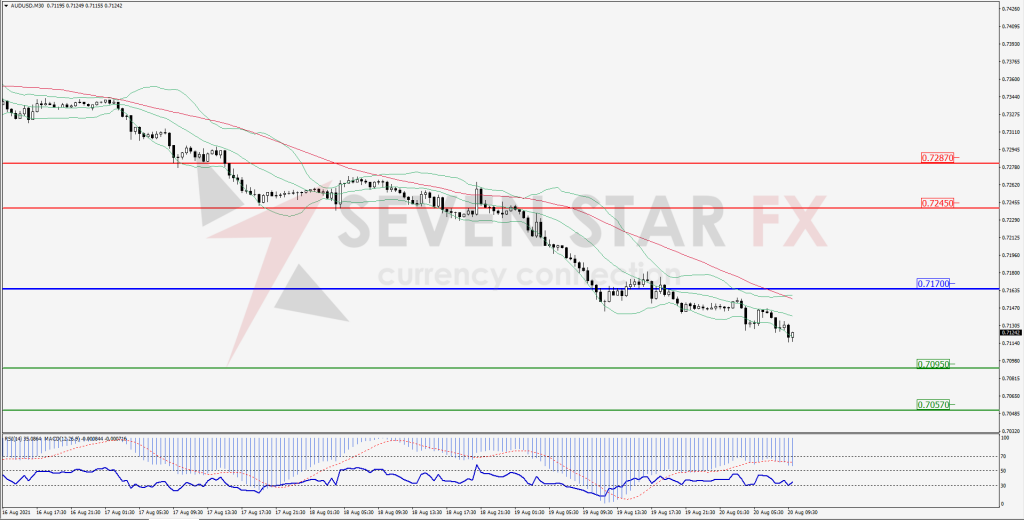
Green Lines Indicate Resistance Levels – Red Lines Indicates Support Levels
Light Blue is a Pivot Point – Black represents the price when the report was produced
CRUDEOIL Intraday: Trend may reverse to upside
Our pivot point is at 63.13
Preferable Price Action: Above pivots buy Oil with65.53 & 66.57 as targets.
Alternative Price Action: Sell crude below pivot with targets at 60.85 and 59.81 in extension.
Comment: Crude is above its 55MA & 20MA and MACD in the positive territory.
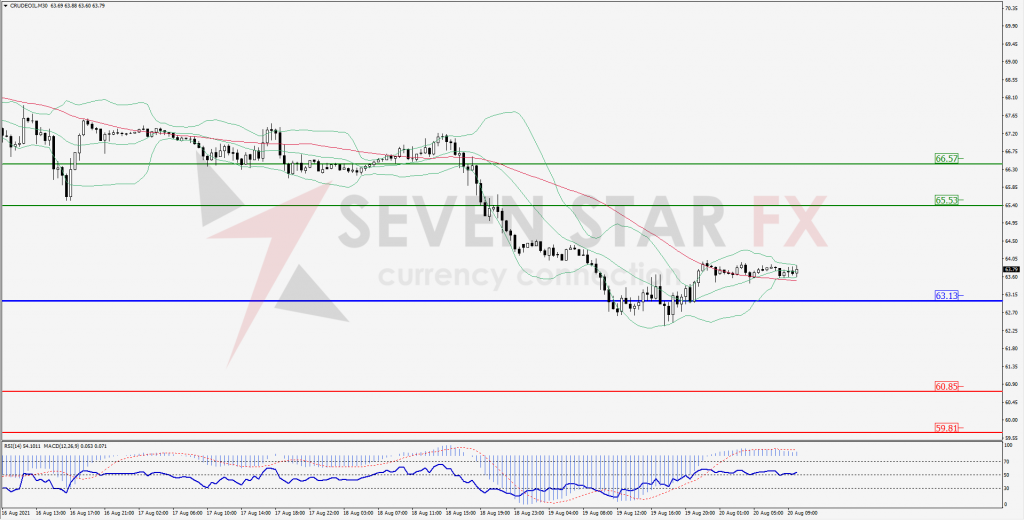
Green Lines Indicate Resistance Levels – Red Lines Indicates Support Levels
Light Blue is a Pivot Point – Black represents the price when the report was produced
XAU/USD Intraday: In a consolidation zone
Our pivot point is 1781.20
Preferable Price Action: Further upside to 1799.00 & 1807.00.
Alternative Price Action: If the price gives a downside breakout of a pivot, then the price extends to 1764.40 and 1756.40.
Comment: MACD in positive territory and price above its 55MA & 20MA.
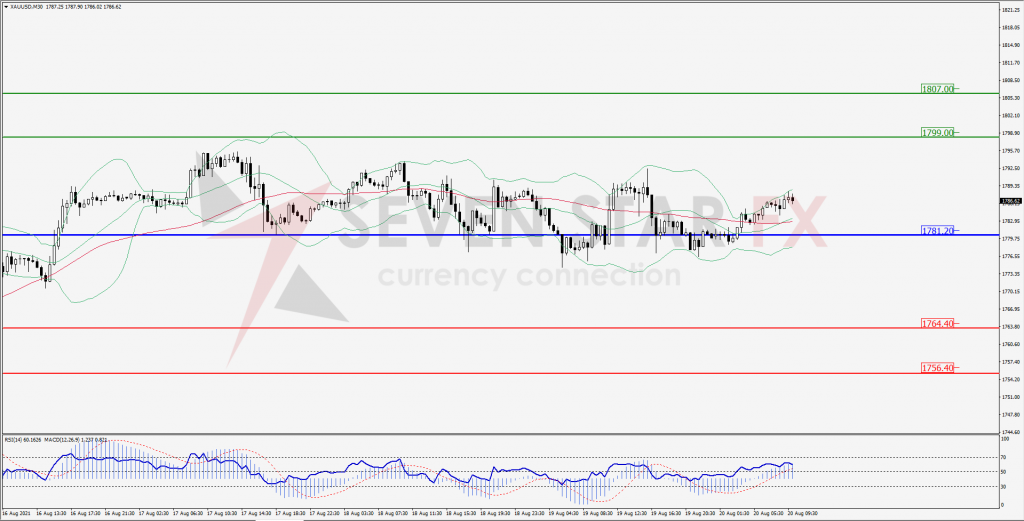
Green Lines Indicate Resistance Levels – Red Lines Indicates Support Levels
Light Blue is a Pivot Point – Black represents the price when the report was produced
Dow Jones Intraday: Resistance at 34,987.00
Our pivot point is 34,987.00
Preferable Price Action: Take short positions below pivot with targets at 34,613.00 & 34,366.00.
Alternative Price Action: above 35,987.00 looks for further upside to 35,366.00 & 35,615.00.
Comment: Price below its 20MA & 55MA and RSI below 50 levels.
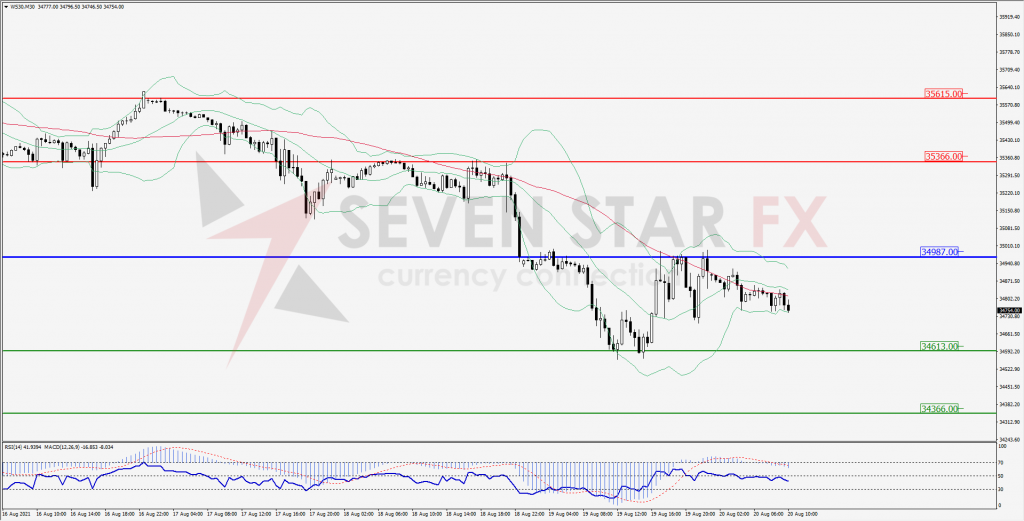
Green Lines Indicate Resistance Levels – Red Lines Indicates Support Levels
Light Blue is a Pivot Point – Black represents the price when the report was produced