Market Wrap: Stocks, Bonds, Commodities
Major stock indexes slid and oil posted its fourth straight day of declines as investors grappled with mixed economic data and considered the economic impact of the ongoing spread of the Delta coronavirus variant.
The Dow Jones Industrial Average fell 0.79% to 35,343.28, snapping a five-day winning streak. The S&P 500 lost 0.71% to 4,448.08 after posting a new record high on Monday, and the Nasdaq Composite dropped 0.93% to 14,656.20.
Asian shares edged off near year-to-date lows on Wednesday despite Wall Street’s overnight declines, while New Zealand’s central bank defied expectations by not raising interest rates as the country is in lockdown due to cases of the COVID-19 Delta variant.
MSCI’s index of Asia-Pacific stocks outside Japan gained 0.59% to 808.24 levels. Australian index lost 0.12% to 7,502.10. Japanese Nikkei traded 0.59% higher to 27,585.91.
European stocks were lower on Wednesday, with the Stoxx Europe 50 Index decline 0.30% to 4,183.75, Germany’s DAX fell 0.24% to 15,883.20, and France’s CAC down 0.30% to 6,799.71, and U.K.’s FTSE 100 lost 0.21% to 7,166.25.
Benchmark 10-year U.S. Treasury rose as demand for safe assets grows again, today 10-year bond yields higher 0.16% to 1.260.
Crude Oil posted its fourth straight day of declines as investors grappled with mixed economic data and considered the economic impact of the ongoing spread of the Delta coronavirus variant.
Spot Brent crude oil rose 0.45% to $69.34 per barrel. US West Texas Intermediate crude up 0.36% to $66.58 a barrel.
The yellow metal traded 0.05% higher to 1788.30 dollars per ounce.
Market Wrap: Forex
The dollar hit a nine-month high against the euro and held broad gains elsewhere on Wednesday as investors have cut exposure to riskier currencies, mostly on virus concerns, while the kiwi was sent on a loop when the central bank held fire on rate hikes.
Today, the U.S. dollar index measures the greenback against a trade-weighted basket of six major currencies, which slipped 0.10% to 93.073.
The Euro US Dollar (EUR/USD) is a widely traded pair that rose 0.12% today. This left the pairing trading around $1.17190.
The Japanese yen lost against the U.S. dollar on Wednesday as the stock pushes higher. Today US/JPY gained 0.07% to 109.640 level.
Another commodity-related currency mixed against the U.S dollar, AUD/USD gained 0.14% to 0.72580, and NZD/USD flat to 0.69200 level.
EUR/USD Intraday: Trend on the downside
Our pivot point is at 1.17350
Preferable Price Action: Take short positions below pivot level with targets at 1.16980 & 1.16780 in extension.
Alternative Price Action: Above pivot looks for a further upside to 1.17750 & 1.17970.
Comment: Pair below its 55MA and RSI at 50 levels.
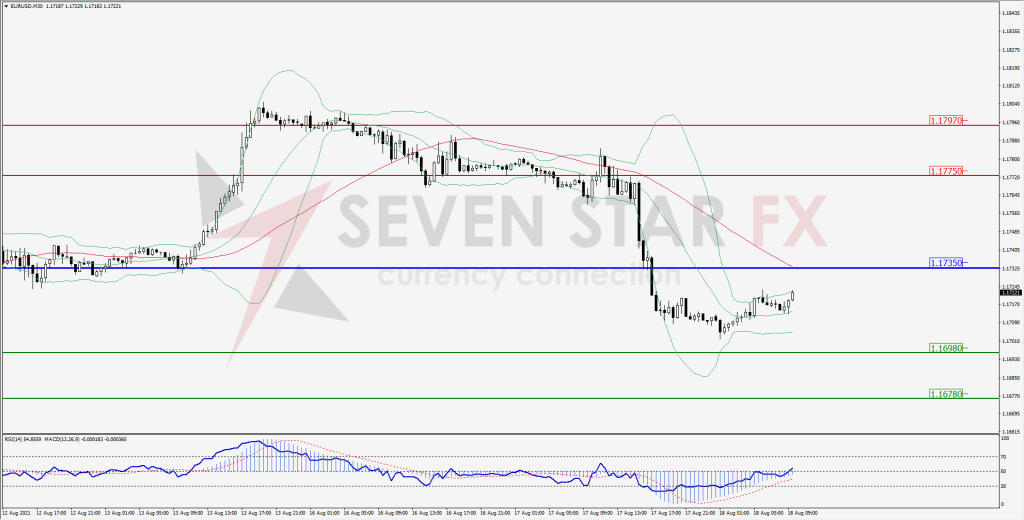
Green Lines Indicate Resistance Levels – Red Lines Indicates Support Levels
Light Blue is a Pivot Point – Black represents the price when the report was produced
GBP/USD Intraday: Trend on the downside
Our pivot point is at 1.37780
Preferable Price Action: Sell positions below pivot with targets at 1.37220 & 1.36970 in extension.
Alternative Price Action: The price above pivot would call for further upside to 1.38330 & 1.38580.
Comment: Price below its 55MA and RSI at 50 levels.
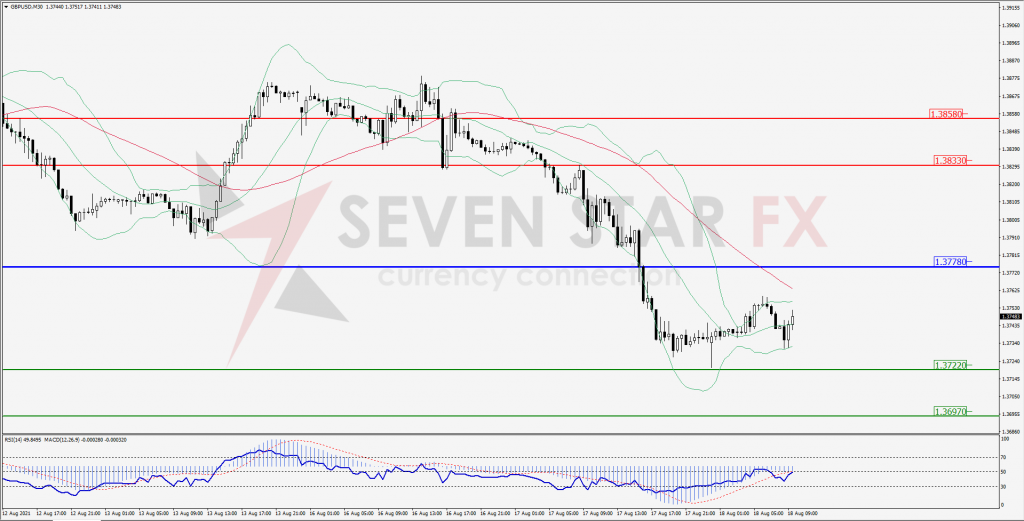
Green Lines Indicate Resistance Levels – Red Lines Indicates Support Levels
Light Blue is a Pivot Point – Black represents the price when the report was produced
USD/JPY Intraday: Break resistance level
Our pivot point is at 109.410
Preferable Price Action: Buy position above pivot with the target at 109.910 and 110.190 in extension.
Alternative Price Action: The downside breakout of the pivot would call for 108.950 and 108.700.
Comment: price above its 20MA & 55MA and MACD in positive territory.
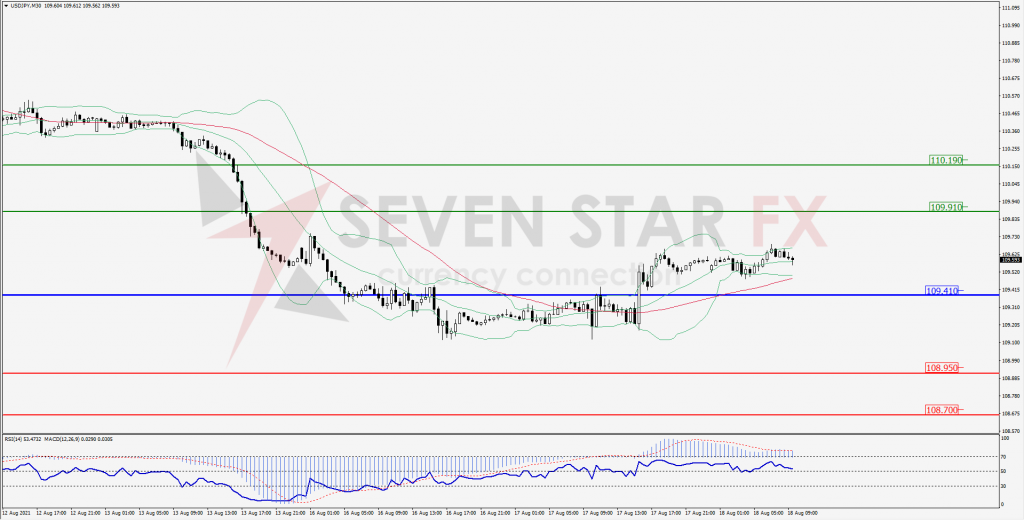
Green Lines Indicate Resistance Levels – Red Lines Indicates Support Levels
Light Blue is a Pivot Point – Black represents the price when the report was produced
AUD/USD Intraday: Trend may reverse to upside
Our pivot point is at 0.72480
Preferable Price Action: Buy Positions above pivot with targets at 0.73090 & 0.73480 in extension.
Alternative Price Action: Below pivot looks for a further downside with 0.71820 & 0.71450 as targets.
Comment: Pair above its 20MA and RSI above 50 levels.
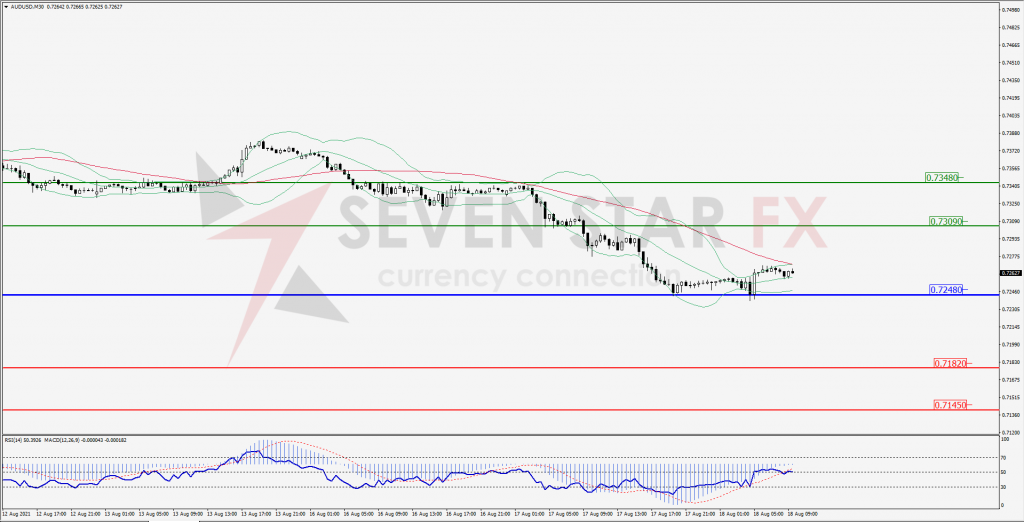
Green Lines Indicate Resistance Levels – Red Lines Indicates Support Levels
Light Blue is a Pivot Point – Black represents the price when the report was produced
CRUDEOIL Intraday: Support at 66.21
Our pivot point is at 66.21
Preferable Price Action: Above pivots buy Oil with 67.44 & 68.21 as targets.
Alternative Price Action: Sell crude below pivot with targets at 64.95 and 64.17 in extension.
Comment: Crude is above its 55MA & 20MA and MACD in the positive territory.
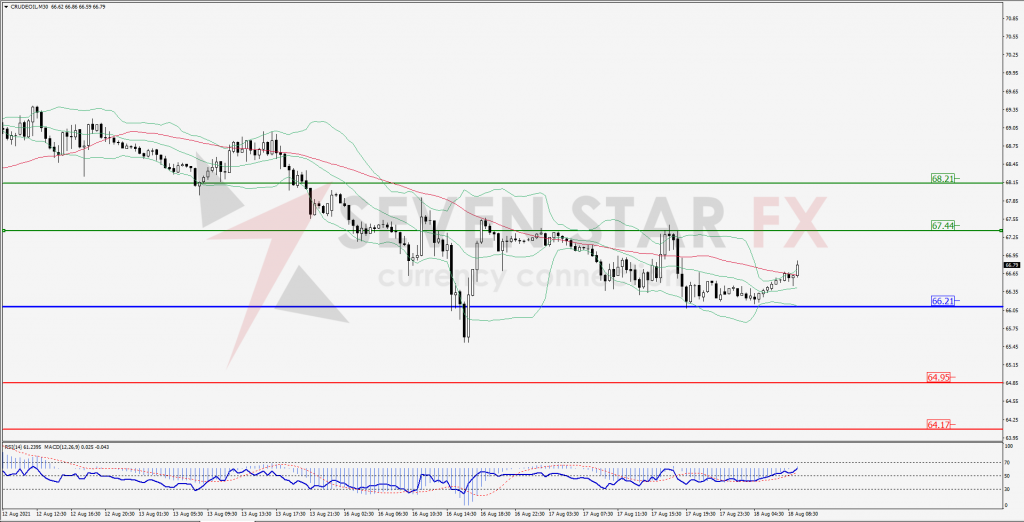
Green Lines Indicate Resistance Levels – Red Lines Indicates Support Levels
Light Blue is a Pivot Point – Black represents the price when the report was produced
XAU/USD Intraday: Strong trend on the upside
Our pivot point is 1786.20
Preferable Price Action: Further upside to 1804.30 & 1813.10.
Alternative Price Action: If the price gives a downside breakout of a pivot, then the price extends to 1766.40 and 1757.10.
Comment: MACD in positive territory and price above its 55MA & 20MA.
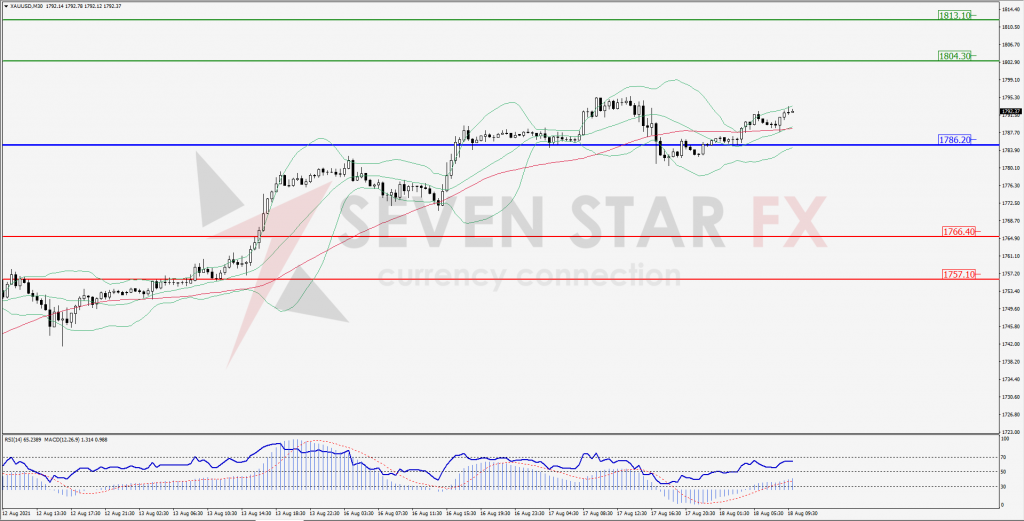
Green Lines Indicate Resistance Levels – Red Lines Indicates Support Levels
Light Blue is a Pivot Point – Black represents the price when the report was produced
Dow Jones Intraday: Support at 35,244.00
Our pivot point is 35,244.00
Preferable Price Action: Take long positions above pivot with targets at 35,428.00 & 35,527.00.
Alternative Price Action: below 35,244.00 looks for further downside to 35,055.00 & 34,961.00.
Comment: Price above its 20MA and RSI at 50 levels.
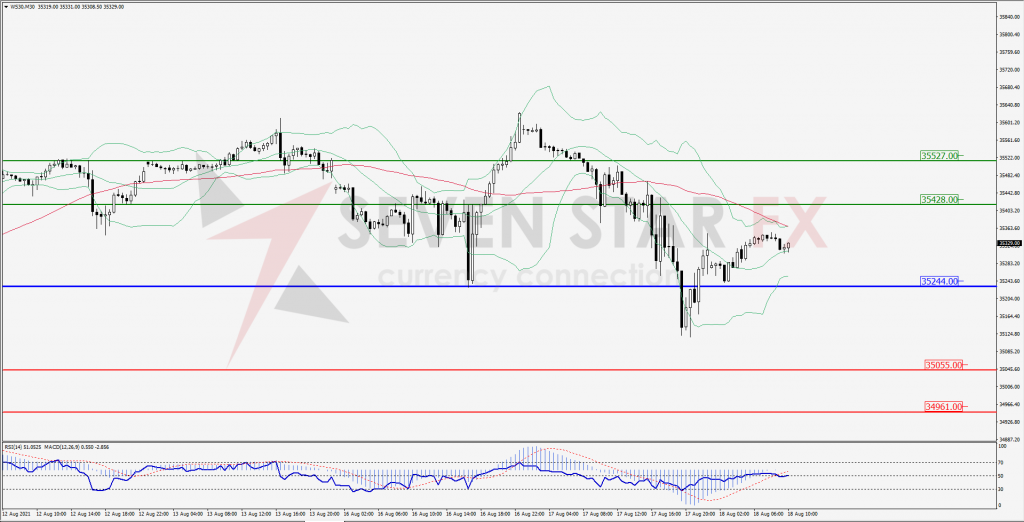
Green Lines Indicate Resistance Levels – Red Lines Indicates Support Levels
Light Blue is a Pivot Point – Black represents the price when the report was produced