Market Wrap: Stocks, Bonds, Commodities
The S&P 500 ended lower on Monday, with Tesla and other growth stocks losing ground after downbeat Chinese economic data added to worries about a global slowdown and rising interest rates.
The S&P 500 lose (0.39%) ended at 4,008.01 points, while the Nasdaq Composite down 1.20% to 11,662.79. The Dow Jones Industrial was rose 0.08% to 32,223.42.
MSCI’s index of Asia-Pacific stocks outside Japan is ascend 2.24% to 656.61 levels. Australian index higher 0.27% to 7,112.50. Japanese Nikkei Index ascend 0.42% to 26,659.75.
European stocks were positive on Tuesday, with the Stoxx Europe 50 Index gain 1.44% to 3,738.15, Germany’s DAX ascend 1.32% to 14,147.82, and France’s CAC up 1.29% to 6,429.85, and U.K.’s FTSE 100 increase 0.54% to 7,506.55.
Benchmark 10-year U.S. Treasury fell as demand for safe assets ascend again, today 10-year bond yields a positive 2.9150.
Oil prices opened lower in early Asian trade on Tuesday after the European Union’s efforts to enact a ban on Russian oil imports, a move that would tighten global supply, ran into resistance from member country Hungary.
Spot Brent crude oil rose 0.09% to $114.32 per barrel. US West Texas Intermediate crude is down 0.04% to $111.82 a barrel.
The yellow metal gold is advance 0.50% to 1,822.78 dollars per ounce.
Market Wrap: Forex
The U.S. dollar edged lower in early European trade Tuesday, slipping back from a 20-year high as gains in global equity markets helped risk appetite rebound to the detriment of this safe haven.
Today, the U.S. dollar index measures the Greenback against a trade-weighted basket of six major currencies, which is a fell of 0.24% to 103.955.
The Euro US Dollar (EUR/USD) is a widely traded pair that is up 0.29% today. This left the pair trading around $1.04620.
The Japanese yen was positive against the U.S. dollar on Tuesday as the stock up. Today USD/JPY is gain 0.19% to 129.410 level.
Another commodity-related currency positive against the U.S dollar, AUD/USD ascend 0.57 to 0.70100, and NZD/USD higher 0.60% to 0.63450 level.
EUR/USD Intraday: Trend on The Upside
Our pivot point is at 1.04500
Preferable Price Action: Take buy positions above pivot level with targets at 1.05150 & 1.05650 in extension.
Alternative Price Action: Below pivot looks for a further downside to 1.03900 & 1.03410.
Comment: RSI above 50 levels and Pair above its 20MA & 55MA.
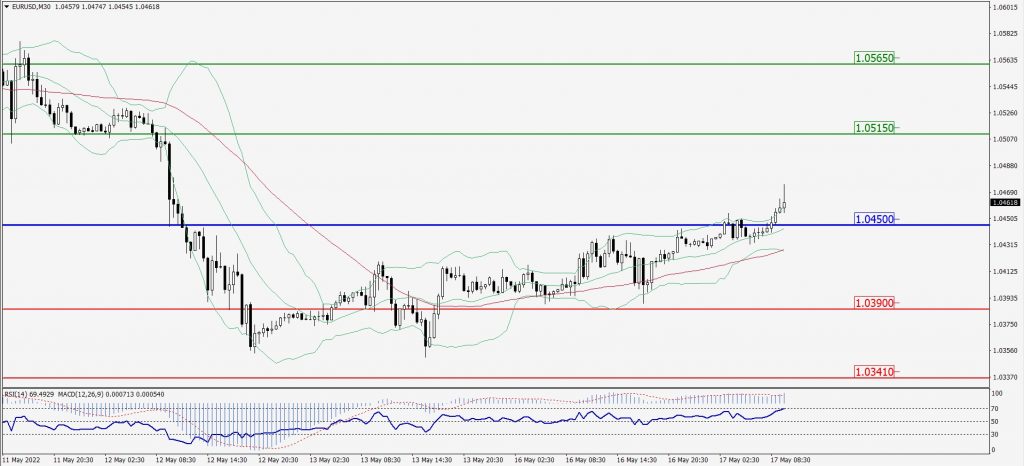
Green Lines Indicate Resistance Levels – Red Lines Indicate Support Levels
Light Blue is a Pivot Point – Black represents the price when the report was produced
GBP/USD Intraday: Major Trend on The Upside
Our pivot point is at 1.23650
Preferable Price Action: Buy positions above pivot with targets at 1.25160 & 1.26060 in extension.
Alternative Price Action: The price below pivot would call for further downside to 1.22360 & 1.21300.
Comment: RSI above 50 levels pair above its 20MA & 55MA.
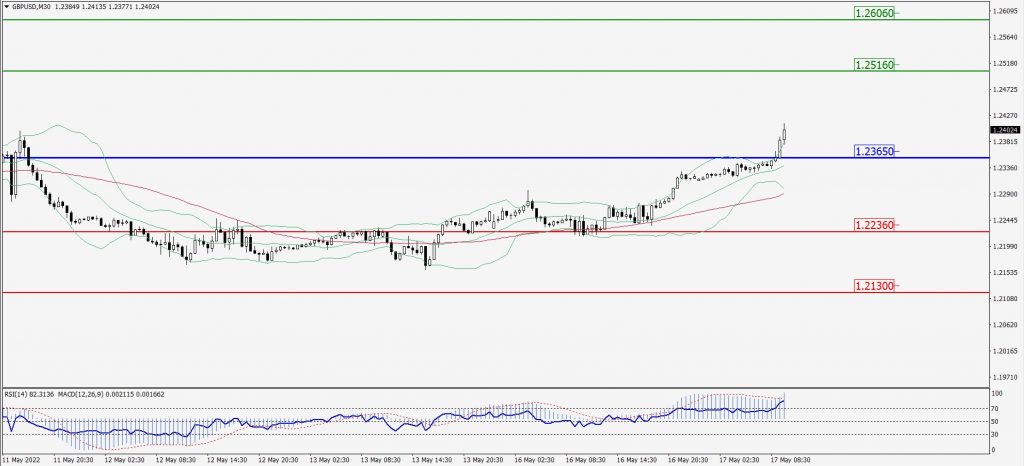
Green Lines Indicate Resistance Levels – Red Lines Indicate Support Levels
Light Blue is a Pivot Point – Black represents the price when the report was produced
USD/JPY Intraday: Major Support Level at 129.150
Our pivot point is at 129.150
Preferable Price Action: Buy position above pivot with the target at 130.010 and 130.650 in extension.
Alternative Price Action: The downside breakout of the pivot would call for 128.370 and 127.760.
Comment: MACD is positive territory and pair above its 20MA & 55MA.
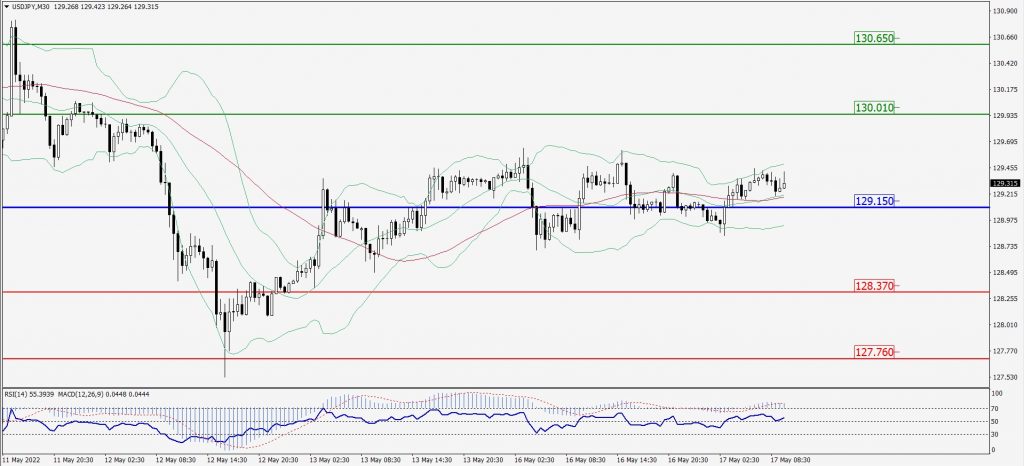
Green Lines Indicate Resistance Levels – Red Lines Indicate Support Levels
Light Blue is a Pivot Point – Black represents the price when the report was produced
AUD/USD Intraday: Maj0r Trend on The Upside
Our pivot point is at 0.69870
Preferable Price Action: Buy Positions above pivot with targets at 0.71060 & 0.71880 in extension.
Alternative Price Action: Below pivot looks for a further downside with 0.68850 & 0.67940 as targets.
Comment: RSI above 50 levels and Pair above its 20MA & 55MA.
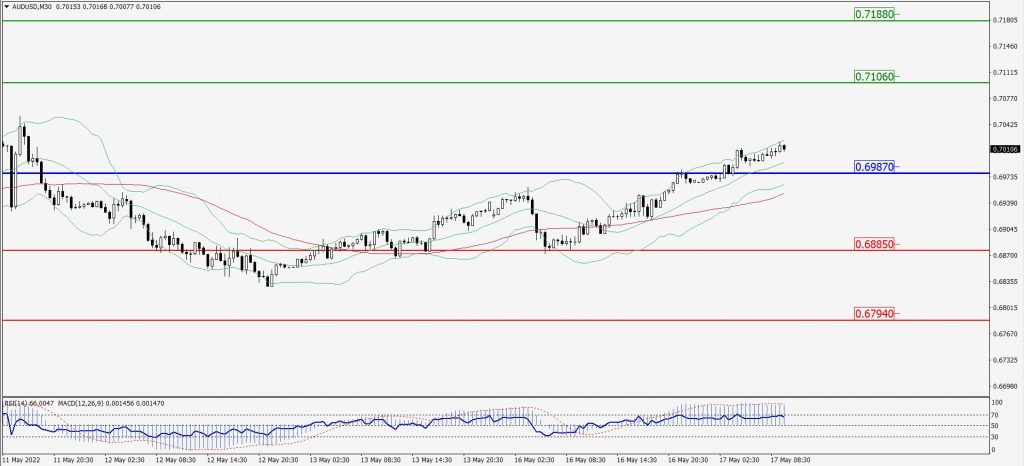
Green Lines Indicate Resistance Levels – Red Lines Indicate Support Levels
Light Blue is a Pivot Point – Black represents the price when the report was produced
CRUDEOIL Intraday: Trend on The Upside
Our pivot point is at 110.55
Preferable Price Action: Above pivots Buy oil with 115.94 & 120.06 as targets.
Alternative Price Action: Sell crude below pivot with targets at 105.56 and 101.00 in extension.
Comment: MACD is in the positive territory and Pair above 55MA.
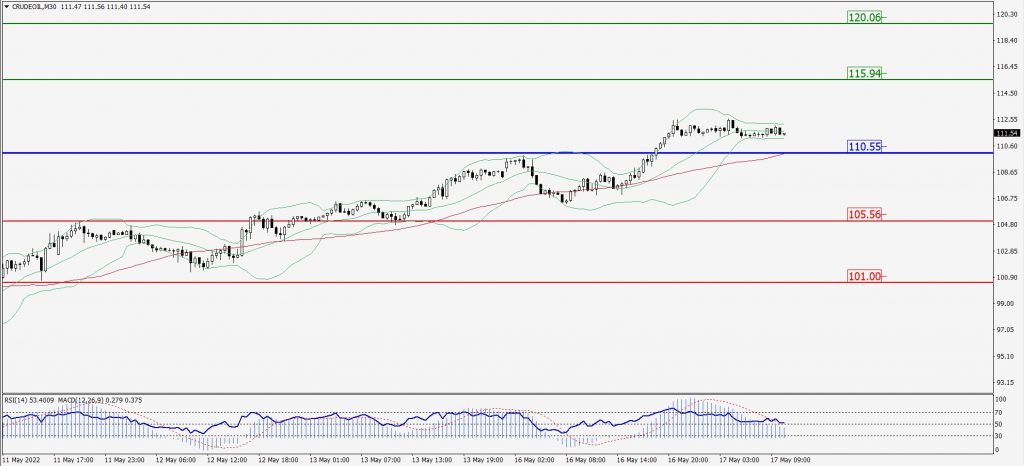
Green Lines Indicate Resistance Levels – Red Lines Indicate Support Levels
Light Blue is a Pivot Point – Black represents the price when the report was produced
XAU/USD Intraday: Trend on The Upside
Our pivot point is 1821.40
Preferable Price Action: Further upside to 1845.00 and 1861.20.
Alternative Price Action: If the price gives a downside breakout of a pivot, then the price extends to 1800.60 and 1784.70.
Comment: MACD is positive territory and pair above 55MA.
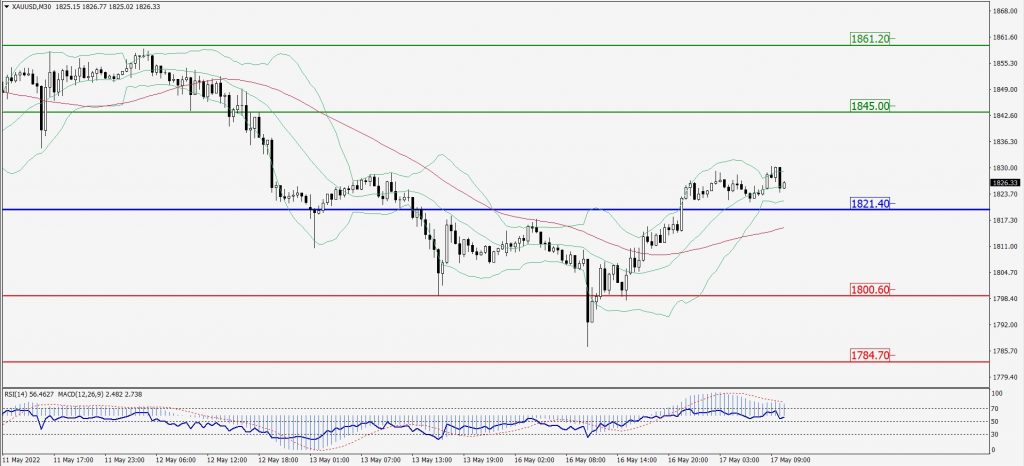
Green Lines Indicate Resistance Levels – Red Lines Indicate Support Levels
Light Blue is a Pivot Point – Black represents the price when the report was produced
Dow Jones Intraday: Trend on The Upside
Our pivot point is 32,221.00
Preferable Price Action: Take Buy positions above pivot with targets at 32,950.00 & 33,538.00.
Alternative Price Action: Below 32,221.00 looks for further downside to 31,526.00 & 30,969.00.
Comment: RSI above 50 levels and Pair above its 20MA & 55MA.
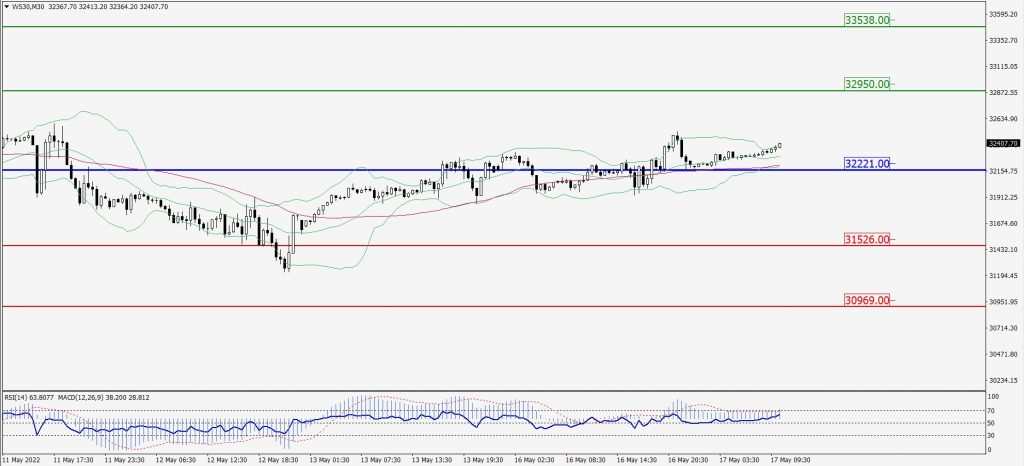
Green Lines Indicate Resistance Levels – Red Lines Indicate Support Levels
Light Blue is a Pivot Point – Black represents the price when the report was produced