Market Wrap: Stocks, Bonds, Commodities
Most Asian currencies advanced slightly on Wednesday, gaining more ground against the dollar amid growing optimism that the Federal Reserve was close to cutting interest rates.
The Dow Jones Industrial Average rose 742.76 points to 40,954.48, the S&P 500 gain 0.64% to 5,667.20 and the Nasdaq Composite ascend 38.29 points to 18,510.86.
MSCI’s index of Asia-Pacific stocks outside Japan is down 0.31% to 712.33 levels. The Australian index was higher by 0.73% to 8,057.90. Japanese Nikkei Index decrease 0.31% today.
European stocks were negative on Wednesday, with the Stoxx Europe 50 Index decrease 0.42% to 4,927.05, Germany’s DAX descend 0.06% to 18,513.45, and France’s CAC lower 0.02% to 7,579.78 and U.K.’s FTSE 100 loss 0.12% to 8,154.89.
Benchmark 10-year U.S. Treasury rose as demand for safe assets slipped again, today 10-year bond yields increase 0.39% to 4.1780.
Oil prices eased on Wednesday, with global benchmark Brent hovering near a one-month low hit in the prior session on signs of weakening demand in China, although losses were capped by declining U.S. oil stockpiles.
Spot Brent crude oil increase 0.10% to $83.81 per barrel. US West Texas Intermediate crude is increase 0.16% to $79.84 a barrel.
The yellow metal gold is up 0.19% to 2,472.60 dollars per ounce.
Market Wrap: Forex
The dollar has found its footing after bruising few weeks, but just as the bears sharpen their claws to take another swipe, some point to favorable fundamentals including the pricing of rate cuts that will provide the greenback with plenty of fight.
Today, the U.S. dollar index measures the Greenback against a trade-weighted basket of six major currencies, which decrease 0.14% to 103.8150.
The Euro US Dollar (EUR/USD) is a widely traded pair that is ascend 0.07% today. This left the pair trading around $1.09050.
The Japanese yen was will move negative against the U.S. dollar on Wednesday. Today USD/JPY is trades pair that decrease 0.59% to the 157.410 level.
Another commodity-related currency mixed against the U.S dollar, AUD/USD either up or down 0.02% to 0.67330, and NZD/USD increase 0.46% to 0.60740 level.
EUR/USD Intraday: Trend on the upside
Our pivot point is at 1.09010
Preferable Price Action: Take buy positions above pivot level with targets at 1.09120 & 1.09220 in extension.
Alternative Price Action: Sell pivot looks for a further downside to 1.08900 & 1.08800.
Comment: RSI is above 50 levels and Pairs above its 50MA.
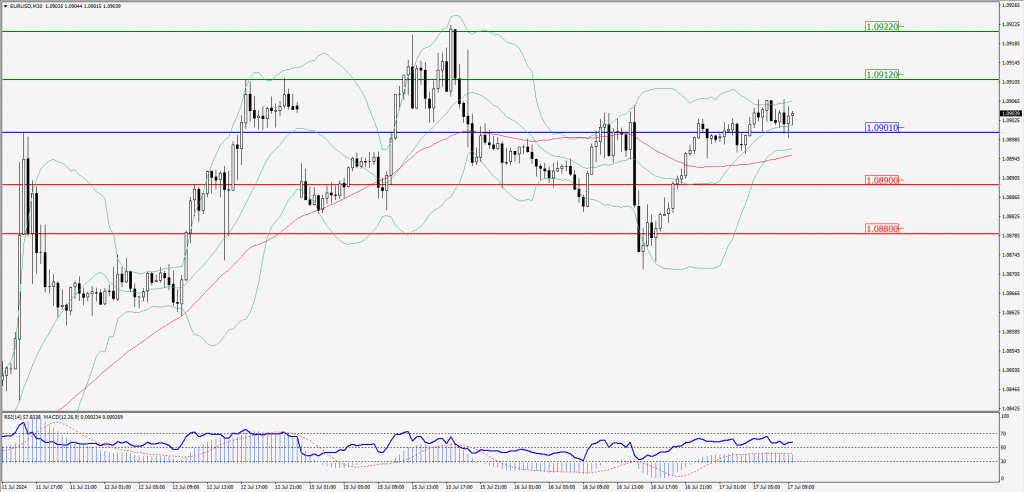
Green Lines Indicate Resistance Levels – Red Lines Indicate Support Levels
Light Blue is a Pivot Point – Black represents the price when the report was produced
GBP/USD Intraday: Trend on the upside
Our pivot point is at 1.29800
Preferable Price Action: Buy positions above pivot with targets at 1.29970 & 1.30120 in extension.
Alternative Price Action: The price below pivot would call for further downside to 1.29620 & 1.29470.
Comment: RSI is above 50 levels and Pairs above its 55MA.
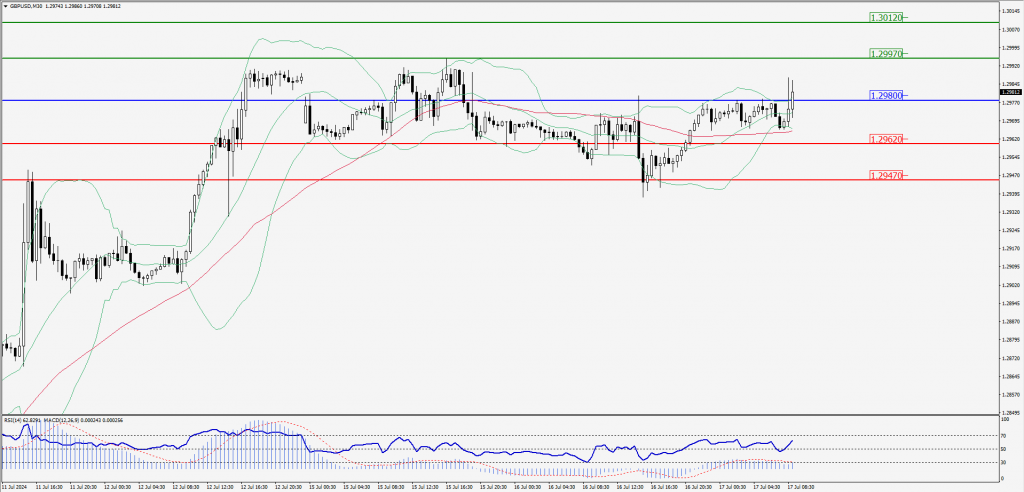
Green Lines Indicate Resistance Levels – Red Lines Indicate Support Levels
Light Blue is a Pivot Point – Black represents the price when the report was produced
USD/JPY Intraday: Major trend on the downside
Our pivot point is at 158.190
Preferable Price Action: Sell position below pivot with the target at 157.680 and 157.200 in extension.
Alternative Price Action: The upside breakout of the pivot would call for 158.750 and 158.270.
Comment: MACD is below 50 levels Pairs below its 20MA & 55MA.
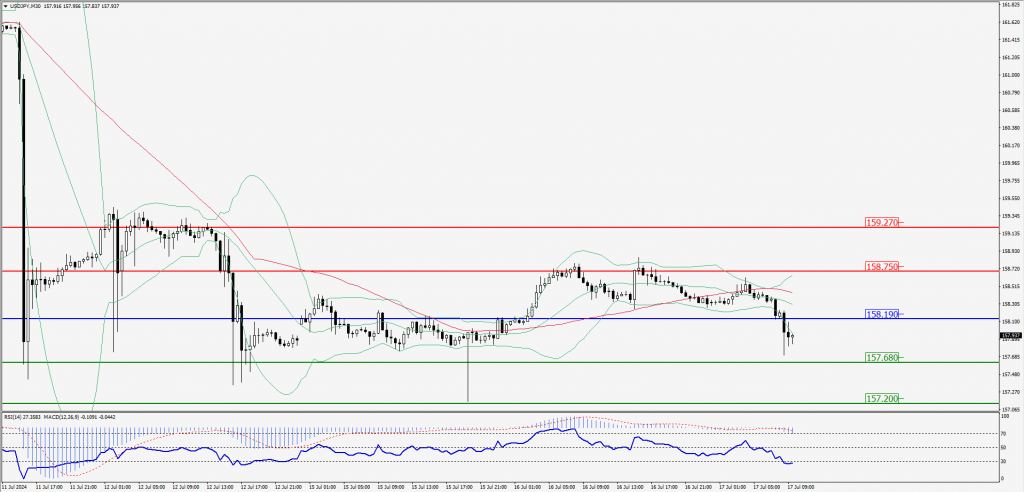
Green Lines Indicate Resistance Levels – Red Lines Indicate Support Levels
Light Blue is a Pivot Point – Black represents the price when the report was produced
AUD/USD Intraday: Trend on the downside
Our pivot point is at 0.67390
Preferable Price Action: Sell positions below pivot with targets at 0.67270 & 0.67180 in extension.
Alternative Price Action: Above pivot a further upside with 0.67520 & 0.67610 as targets.
Comment: RSI is below 50 levels.
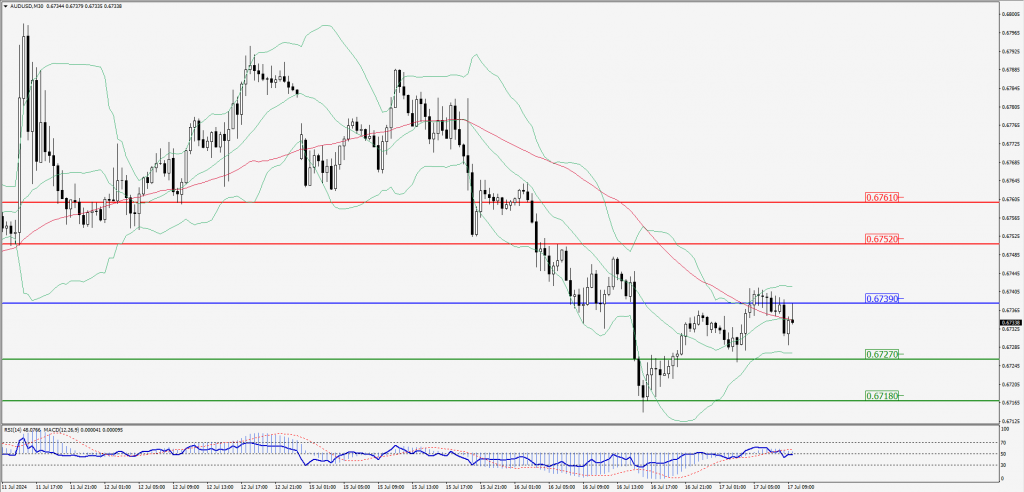
Green Lines Indicate Resistance Levels – Red Lines Indicate Support Levels
Light Blue is a Pivot Point – Black represents the price when the report was produced
CRUDEOIL Intraday: Trend on the downside
Our pivot point is at 79.76
Preferable Price Action: Below pivot sell oil with 79.28 & 78.86 as targets.
Alternative Price Action: Buy crude above pivot with targets at 80.27 and 80.72 in extension.
Comment: RSI is below 50 levels and pairs below its 20MA & 55MA.
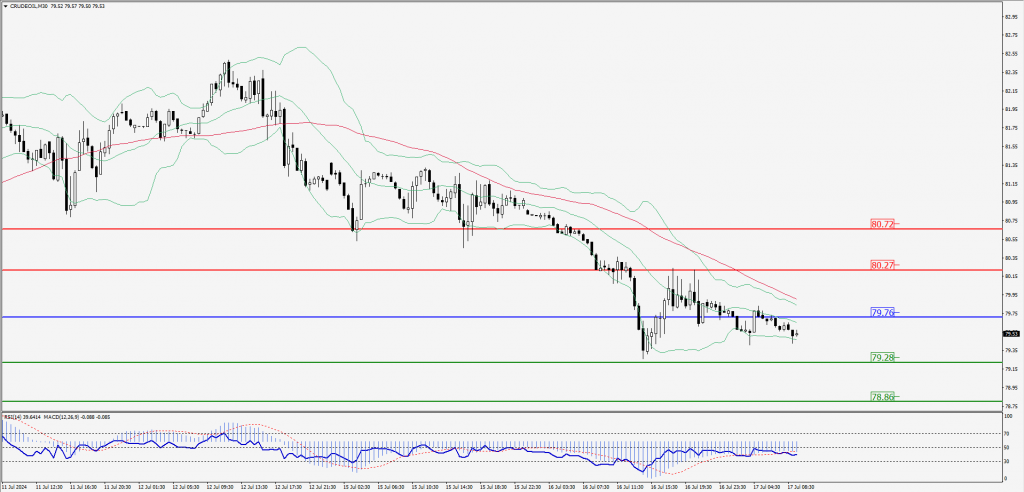
Green Lines Indicate Resistance Levels – Red Lines Indicate Support Levels
Light Blue is a Pivot Point – Black represents the price when the report was produced
XAU/USD Intraday: Trend on the upside
Our pivot point is 2463.30
Preferable Price Action: Further upside to 2476.00 and 2486.70.
Alternative Price Action: If the price gives an downside breakout of a pivot, then the price extends to 2450.50 and 2438.90.
Comment: MACD is above 50 levels and Pairs above its 55MA.
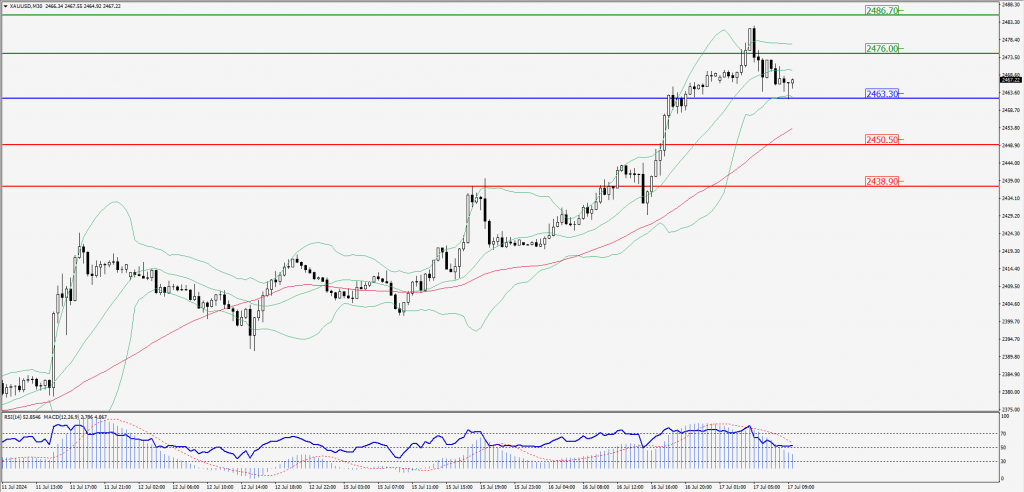
Green Lines Indicate Resistance Levels – Red Lines Indicate Support Levels
Light Blue is a Pivot Point – Black represents the price when the report was produced
Dow Jones Intraday: Trend on the downside
Our pivot point is 40,951.10
Preferable Price Action: Take sell positions below the pivot with targets at 40,753.20 & 40,566.30.
Alternative Price Action: Above 40,951.10 looks for further upside to 41,143.50 & 41,302.90.
Comment: RSI is below 50 levels and pairs below its 20MA.
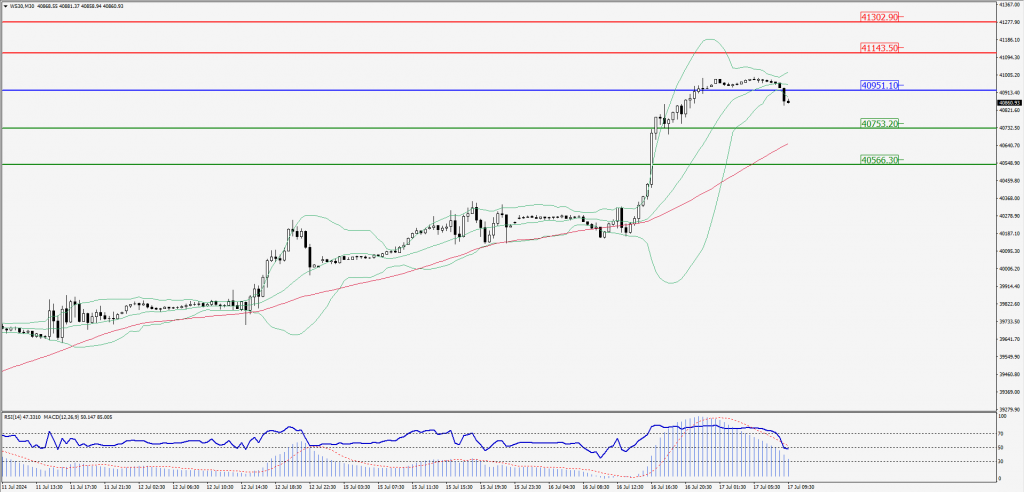
Green Lines Indicate Resistance Levels – Red Lines Indicate Support Levels
Light Blue is a Pivot Point – Black represents the price when the report was produced