Market Wrap: Stocks, Bonds, Commodities
Wall Street’s main indexes fell on Monday, as glum data from China sparked fears of slowing global growth, spurring a risk-off sentiment and a move into defensive stocks amid political turmoil in Afghanistan.
Dow Jones Industrial Average was down 74.12 points (0.21%) at 35,441.26. The S&P 500 was down 15.06 points (0.34%) at 4,452.94, and the Nasdaq Composite was down 127.02 points (0.86%) at 14,695.88.
Major Indices in Asia-Pacific were mostly lower in Tuesday trade despite gains overnight on Wall Street that took the Dow Jones Industrial Average and S&P 500 to record closing highs.
MSCI’s index of Asia-Pacific stocks outside Japan lost 1.53% to 802.61 levels. Australian index lost 0.94% to 7,511.00. Japanese Nikkei traded 0.36% lower to 27,424.47.
European stocks were higher on Tuesday, with the Stoxx Europe 50 Index gained 0.10% to 4,235.20, Germany’s DAX rose 0.25% to 15,980.50, and France’s CAC up 0.15% to 6,850.70, and U.K.’s FTSE 100 flat to 7,168.50.
Benchmark 10-year U.S. Treasury rose as demand for safe assets grows again, today 10-year bond yields lost 2.85% to 1.260.
Oil prices settled lower on Monday, paring steep losses on weak Chinese economic data after sources told Reuters that OPEC and its allies believe the markets do not need more oil than they plan to release in the coming months.
Spot Brent crude oil lost 0.46% to $69.19 per barrel. US West Texas Intermediate crude slipped 0.45% to $66.73 a barrel.
The yellow metal traded 0.18% higher to 1793.05 dollars per ounce.
Market Wrap: Forex
The dollar rose against commodity currencies such as the Australian, New Zealand, and Canadian dollars, while the safe-haven yen gained as disappointing economic data from China, political tension in Afghanistan, and the spreading Delta variant of the coronavirus weighed on risk appetite.
Today, the U.S. dollar index measures the greenback against a trade-weighted basket of six major currencies, which rose 0.15% to 92.757.
The Euro US Dollar (EUR/USD) is a widely traded pair that lost 0.12% today. This left the pairing trading around $1.17610.
The Japanese yen lost against the U.S. dollar on Tuesday as the stock pushes higher. Today US/JPY gained 0.10% to 109.300 level.
Another commodity-related currency lower against the U.S dollar, AUD/USD lost 0.63% to 0.72900, and NZD/USD slipped 1.25% to 0.69270 level.
EUR/USD Intraday: Trend on the upside
Our pivot point is at 1.17840
Preferable Price Action: Take short positions below pivot level with targets at 1.17450 & 1.17220 in extension.
Alternative Price Action: Above pivot looks for a further upside to 1.18190 & 1.18420.
Comment: Pair above its 55MA and RSI below 50 levels.
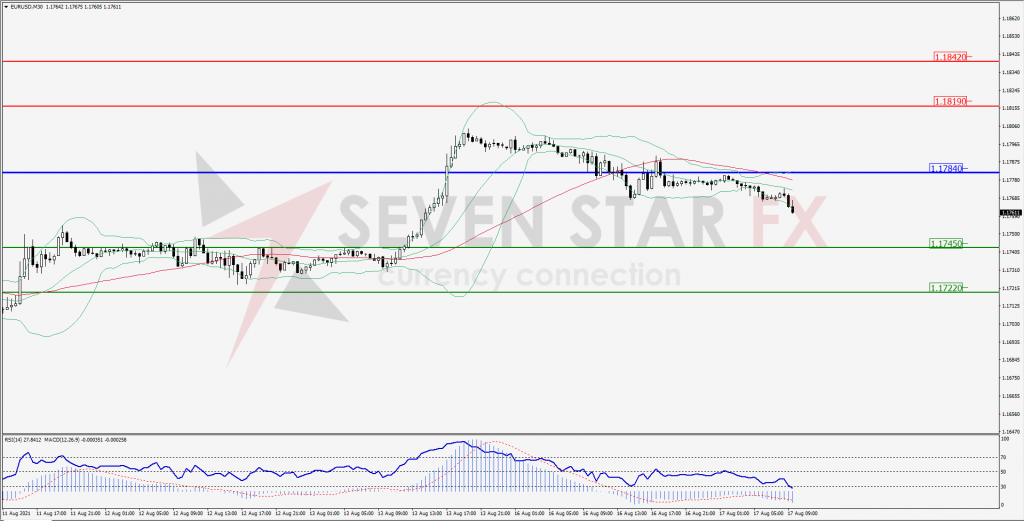
Green Lines Indicate Resistance Levels – Red Lines Indicates Support Levels
Light Blue is a Pivot Point – Black represents the price when the report was produced
GBP/USD Intraday: In a consolidation zone
Our pivot point is at 1.38230
Preferable Price Action: Sell positions below pivot with targets at 1.37820 & 1.37640 in extension.
Alternative Price Action: The price above pivot would call for further upside to 1.38640 & 1.38830.
Comment: Price above its 20MA & 55MA and RSI above 50 levels.
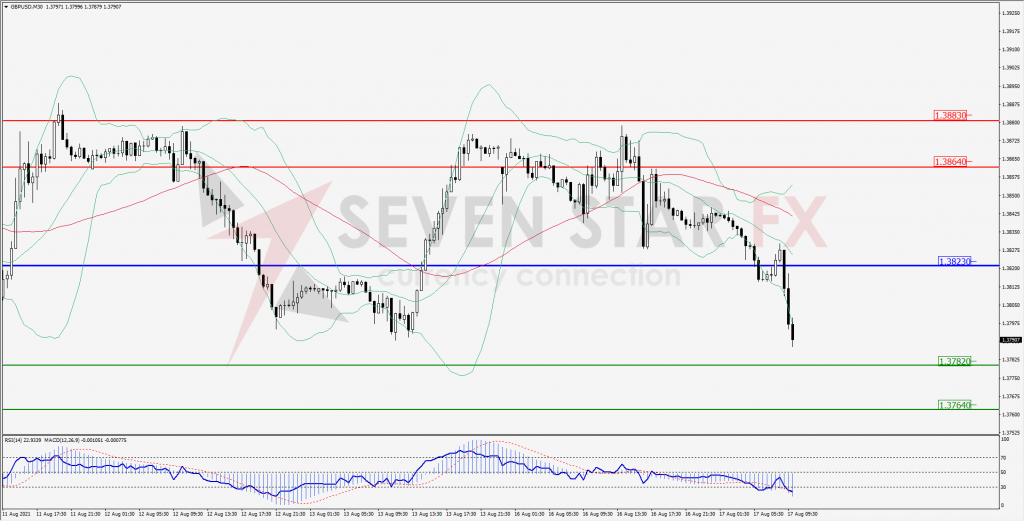
Green Lines Indicate Resistance Levels – Red Lines Indicates Support Levels
Light Blue is a Pivot Point – Black represents the price when the report was produced
USD/JPY Intraday: Trend on the downside
Our pivot point is at 109.520
Preferable Price Action: Sell position below pivot with the target at 108.980 and 108.660 in extension.
Alternative Price Action: The upside breakout of the pivot would call for 110.040 and 110.380.
Comment: price below its 20MA & 55MA and MACD in negative territory.
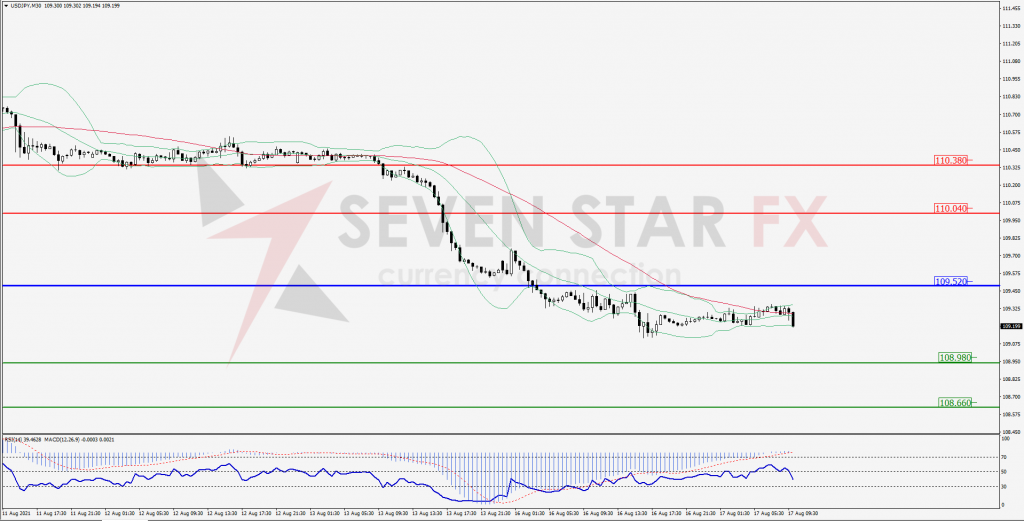
Green Lines Indicate Resistance Levels – Red Lines Indicates Support Levels
Light Blue is a Pivot Point – Black represents the price when the report was produced
AUD/USD Intraday: In a consolidation zone
Our pivot point is at 0.73150
Preferable Price Action: Sell Positions below pivot with targets at 0.72710 & 0.72530 in extension.
Alternative Price Action: Above pivot looks for a further upside with 0.73620 & 0.73820 as targets.
Comment: Pair below its 20MA & 55MA and RSI below 50 levels.
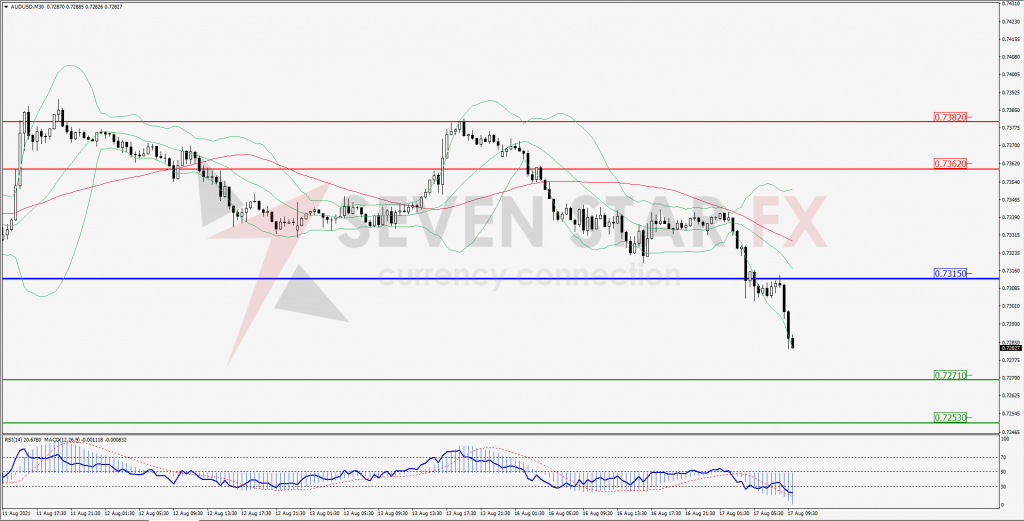
Green Lines Indicate Resistance Levels – Red Lines Indicates Support Levels
Light Blue is a Pivot Point – Black represents the price when the report was produced
CRUDEOIL Intraday: Trend on the downside
Our pivot point is at 67.46
Preferable Price Action: Below pivots sell Oil with 65.74 & 64.71 as targets.
Alternative Price Action: Buy crude above pivot with targets at 69.14 and 70.17 in extension.
Comment: Crude is below its 55MA & 20MA and MACD in the negative territory.
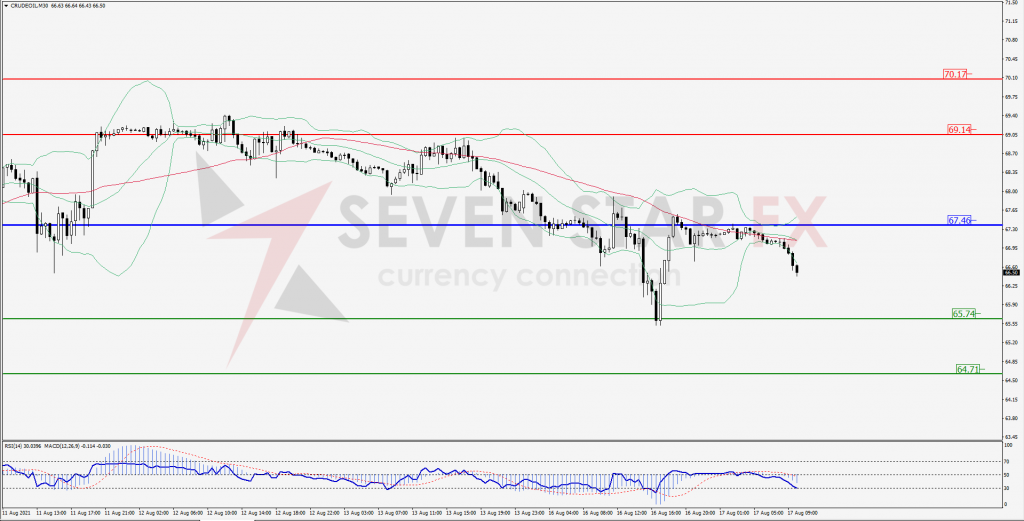
Green Lines Indicate Resistance Levels – Red Lines Indicates Support Levels
Light Blue is a Pivot Point – Black represents the price when the report was produced
XAU/USD Intraday: Strong trend on the upside
Our pivot point is 1783.50
Preferable Price Action: Further upside to 1802.30 & 1813.40.
Alternative Price Action: If the price gives a downside breakout of a pivot, then the price extends to 1764.20 and 1752.30.
Comment: MACD in positive territory and price above its 55MA.
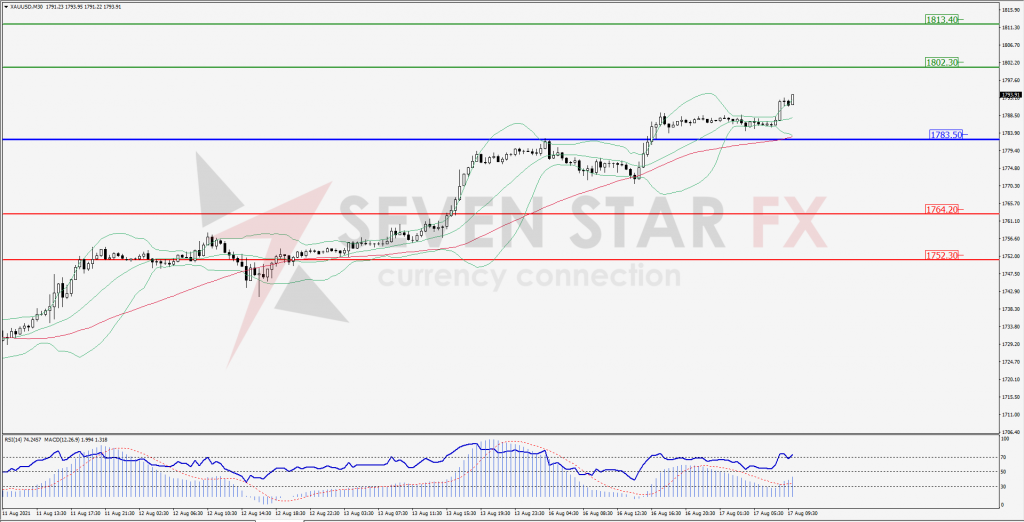
Green Lines Indicate Resistance Levels – Red Lines Indicates Support Levels
Light Blue is a Pivot Point – Black represents the price when the report was produced
Dow Jones Intraday: support at 35,517.00
Our pivot point is 35,517.00
Preferable Price Action: Take short positions below pivot with targets at 35,366.00 & 35,276.00.
Alternative Price Action: above 35,517.00 looks for further upside to 35,662.00 & 35,754.00.
Comment: Price above its 55MA and RSI at 50 levels.
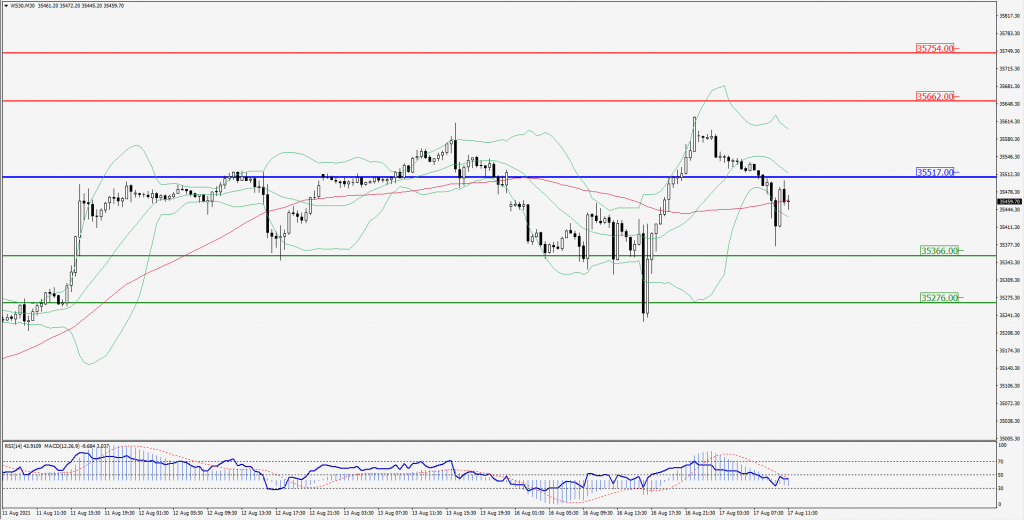
Green Lines Indicate Resistance Levels – Red Lines Indicates Support Levels
Light Blue is a Pivot Point – Black represents the price when the report was produced