Market Wrap: Stocks, Bonds, Commodities
US stocks dropped on Friday as worsening inflation expectations kept intact worries that the Federal Reserve’s aggressive rate hike path could trigger a recession, while investors digested the early stages of earnings season.
The Dow Jones Industrial Average fell 403.89 points to 29,634.83, the S&P 500 lose 86.84 points to 3,583.07 and the Nasdaq Composite subtract 327.76 points to 10,321.39.
MSCI’s index of Asia-Pacific stocks outside Japan is drop 0.50% to 542.43 levels. Australian index lower 1.40% to 6,664.40. Japanese Nikkei Index drop 1.16% to 26,775.79.
European stocks were positive on Monday, with the Stoxx Europe 50 Index rose 0.34% to 3,393.25, Germany’s DAX ascend 0.45% to 12,496.92, and France’s CAC up 0.38% to 5,953.75, and U.K.’s FTSE 100 surged 0.51% to 6,893.80.
Benchmark 10-year U.S. Treasury fell as demand for safe assets ascend again, today 10-year bond yields a negative 1.12% to 3.9610.
Oil prices plummeted more than 3% on Friday as global recession fears and weak oil demand, especially in China, outweighed support from a large cut to the OPEC+ supply target.
Spot Brent crude oil add 1.14% to $92.67 per barrel. US West Texas Intermediate crude is up 1.15% to $85.59 a barrel.
The yellow metal gold is advance 0.79% to 1,662.05 dollars per ounce.
Market Wrap: Forex
Sterling inched cautiously higher following British Prime Minister Liz Truss’s partial reversal of her government’s economic plan, while the yen was pinned near a 32-year low as markets awaited signs of intervention from Japanese authorities.
Today, the U.S. dollar index measures the Greenback against a trade-weighted basket of six major currencies, which is fell 0.34% to 112.810.
The Euro US Dollar (EUR/USD) is a widely traded pair that is up 0.34% today. This left the pair trading around $0.97510.
The Japanese yen was positive against the U.S. dollar on Monday as the stock up. Today USD/JPY is drop 0.05% to 148.680 level.
Another commodity-related currency positive against the U.S dollar, AUD/USD surged 0.79% to 0.62440, and NZD/USD add 0.58 to 0.55940 level.
EUR/USD Intraday: In a consolidation zone
Our pivot point is at 0.97360
Preferable Price Action: Take buy positions below pivot level with targets at 0.97810 & 0.98100 in extension.
Alternative Price Action: Below pivot looks for a further downside to 0.97010 & 0.96730.
Comment: RSI at 50 levels.
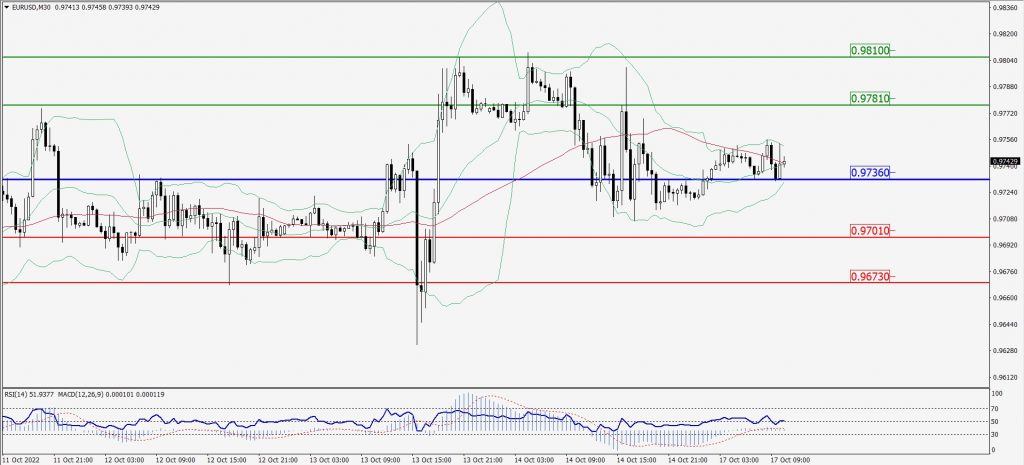
Green Lines Indicate Resistance Levels – Red Lines Indicate Support Levels
Light Blue is a Pivot Point – Black represents the price when the report was produced
GBP/USD Intraday: Trend on the upside
Our pivot point is at 1.12280
Preferable Price Action: Buy positions above pivot with targets at 1.13380 & 1.14220 in extension.
Alternative Price Action: The price below pivot would call for further downside to 1.11420 & 1.10750.
Comment: RSI above 50 levels and Pairs above its 20MA & 55MA.
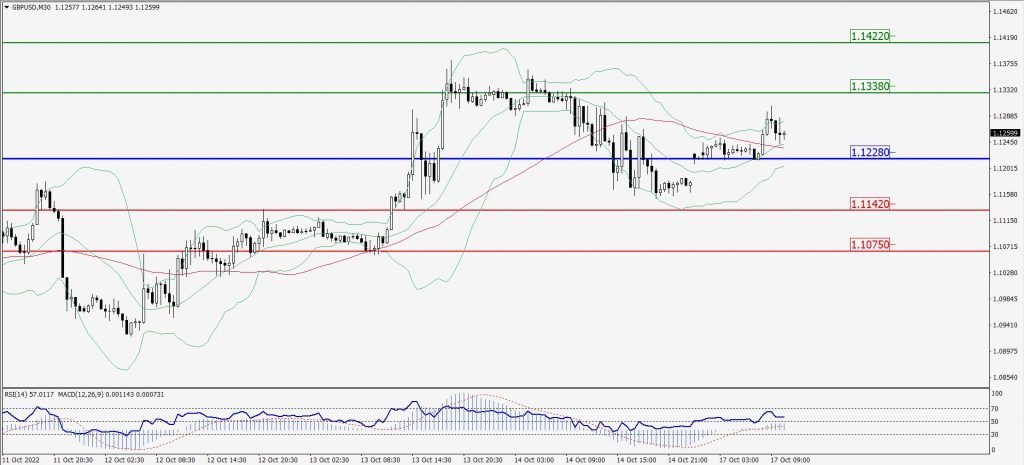
Green Lines Indicate Resistance Levels – Red Lines Indicate Support Levels
Light Blue is a Pivot Point – Black represents the price when the report was produced
USD/JPY Intraday: Major trend on the upside
Our pivot point is at 148.550
Preferable Price Action: Buy position above pivot with the target at 149.500 and 150.170 in extension.
Alternative Price Action: The downside breakout of the pivot would call for 147.700 and 147.060.
Comment: MACD is positive territory and Pairs above 55MA.
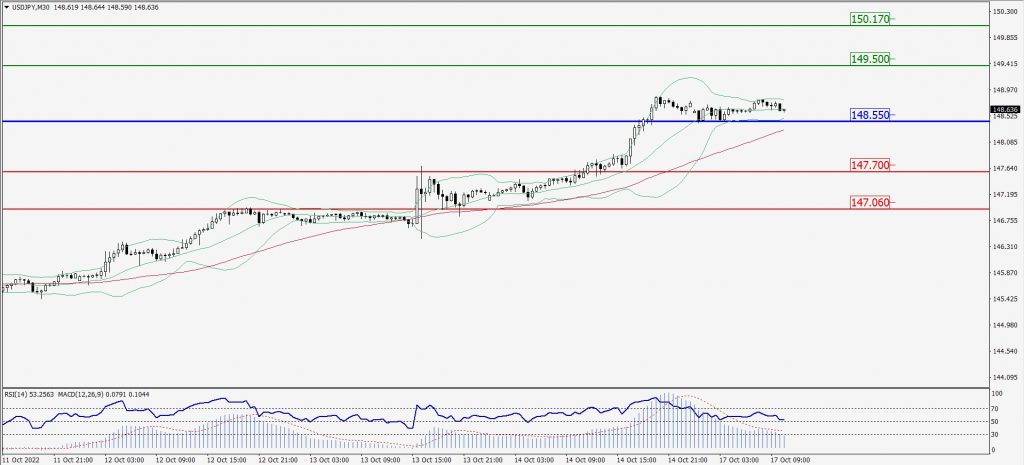
Green Lines Indicate Resistance Levels – Red Lines Indicate Support Levels
Light Blue is a Pivot Point – Black represents the price when the report was produced
AUD/USD Intraday: Trend on the upside
Our pivot point is at 0.62300
Preferable Price Action: Buy Positions above pivot with targets at 0.62870 & 0.63330 in extension.
Alternative Price Action: Below pivot looks for a further downside with 0.61780 & 0.61300 as targets.
Comment: RSI above 50 levels and Pairs above 20MA.
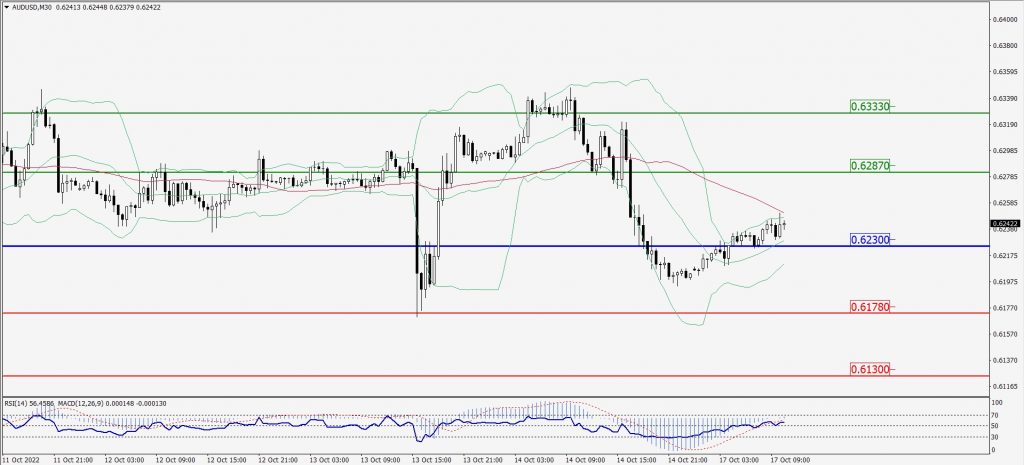
Green Lines Indicate Resistance Levels – Red Lines Indicate Support Levels
Light Blue is a Pivot Point – Black represents the price when the report was produced
CRUDEOIL Intraday: In a consolidation zone
Our pivot point is at 85.25
Preferable Price Action: Above pivots buy oil with 86.73 & 87.90 as targets.
Alternative Price Action: Sell crude below pivot with targets at 83.85 and 82.66 in extension.
Comment: MACD is in the positive territory and Pairs above 20MA.
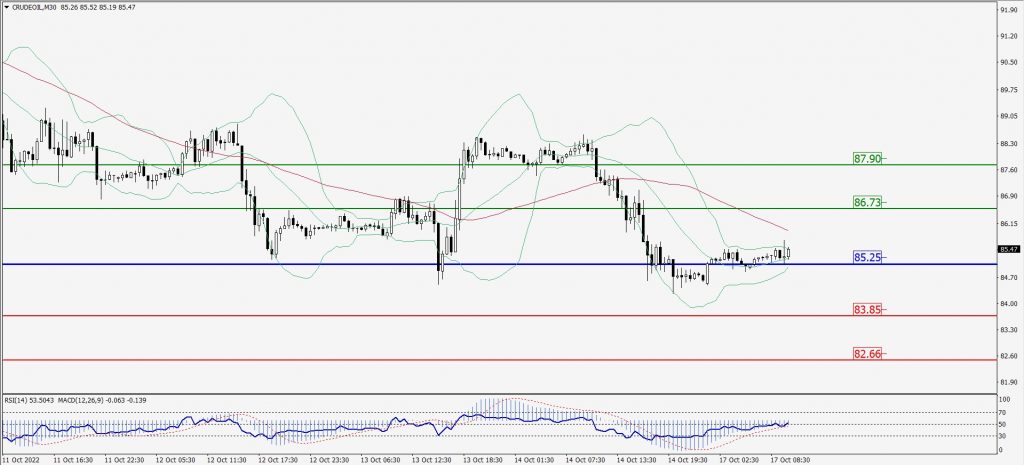
Green Lines Indicate Resistance Levels – Red Lines Indicate Support Levels
Light Blue is a Pivot Point – Black represents the price when the report was produced
XAU/USD Intraday: Trend on the upside
Our pivot point is 1651.10
Preferable Price Action: Further upside to 1662.80 and 1671.20
Alternative Price Action: If the price gives a downside breakout of a pivot, then the price extends to 1641.10 and 1633.20.
Comment: MACD is positive territory and Pairs above 20MA.
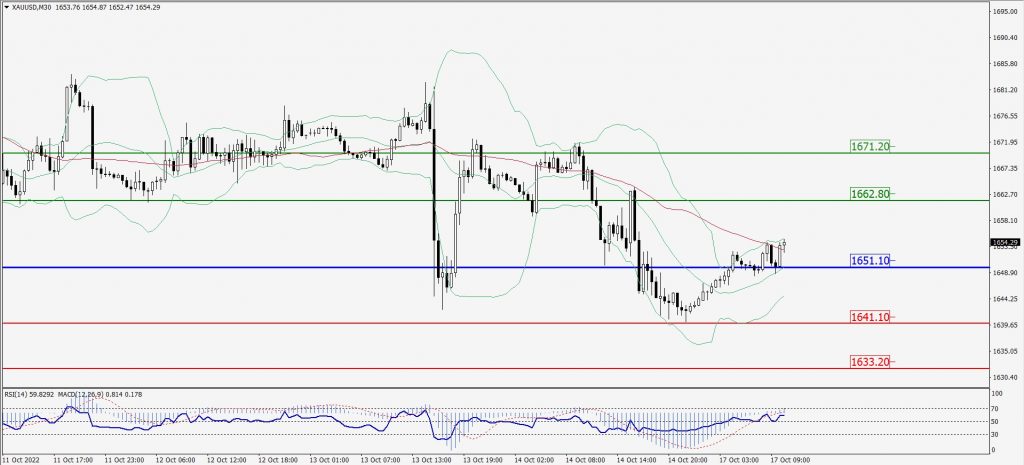
Green Lines Indicate Resistance Levels – Red Lines Indicate Support Levels
Light Blue is a Pivot Point – Black represents the price when the report was produced
Dow Jones Intraday: Trend on the upside
Our pivot point is 29,793.00
Preferable Price Action: Take buy positions above pivot with targets at 30,181.00 & 30,431.00.
Alternative Price Action: Below 29,793.00 looks for further downside to 29,489.00 & 29,266.00.
Comment: RSI above 50 levels and Pairs above 20MA.
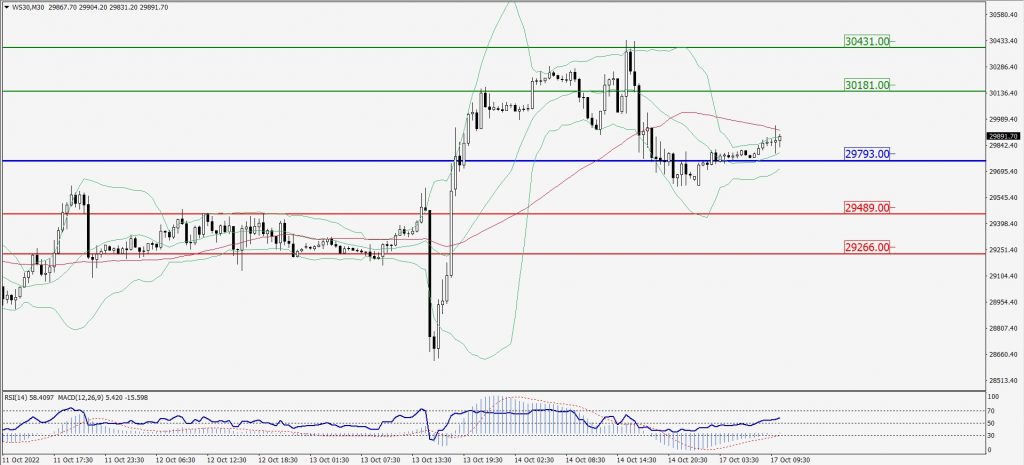
Green Lines Indicate Resistance Levels – Red Lines Indicate Support Levels
Light Blue is a Pivot Point – Black represents the price when the report was produced