Market Wrap: Stocks, Bonds, Commodities
US stocks surged to close more than 2% higher on Thursday, as technical support and investors covering short bets drove a dramatic rebound from a selloff earlier in the day.
The Dow Jones Industrial Average rose 827.87 points to 30,038.72, the S&P 500 gain 92.88 points to 3,669.91 and the Nasdaq Composite add 232.05 points to 10,649.15.
MSCI’s index of Asia-Pacific stocks outside Japan is ascend 1.77% to 547.99 levels. Australian index higher 1.75% to 6,758.80. Japanese Nikkei Index ascend 3.25% to 27,090.76.
European stocks were positive on Friday, with the Stoxx Europe 50 Index rose 1.29% to 3,404.75, Germany’s DAX ascend 1.01% to 12,484.97, and France’s CAC up 1.25% to 5,952.44, and U.K.’s FTSE 100 surged 1.11% to 6,926.12.
Benchmark 10-year U.S. Treasury fell as demand for safe assets ascend again, today 10-year bond yields a negative 1.28% to 3.9030.
Oil prices slipped in early Asian trade on Friday as US crude and gasoline inventories jumped, while Saudi Arabia and Washington continued to clash over plans by OPEC+ to slash production.
Spot Brent crude oil subtract 0.14% to $94.43 per barrel. US West Texas Intermediate crude is down 0.06% to $89.06 a barrel.
The yellow metal gold is decline 0.34% to 1,671.35 dollars per ounce.
Market Wrap: Forex
The U.S. dollar stabilized in early European trading Friday after the release of another hot U.S. inflation number, while sterling retreated from sharp overnight gains amid speculation that the U.K. government is set to withdraw its plans for massive unfunded tax cuts.
Today, the U.S. dollar index measures the Greenback against a trade-weighted basket of six major currencies, which is rose 0.25% to 112.530.
The Euro US Dollar (EUR/USD) is a widely traded pair that is down 0.13% today. This left the pair trading around $0.97600.
The Japanese yen was positive against the U.S. dollar on Friday as the stock up. Today USD/JPY is ascend 0.24% to 147.580 level.
Another commodity-related currency positive against the U.S dollar, AUD/USD surged 0.29% to 0.63160, and NZD/USD add 0.34 to 0.56510 level.
EUR/USD Intraday: Trend on the downside
Our pivot point is at 0.97850
Preferable Price Action: Take sell positions below pivot level with targets at 0.97310 & 0.96920 in extension.
Alternative Price Action: Above pivot looks for a further upside to 0.98310 & 0.98660.
Comment: RSI below 50 levels and Pairs below 20MA.
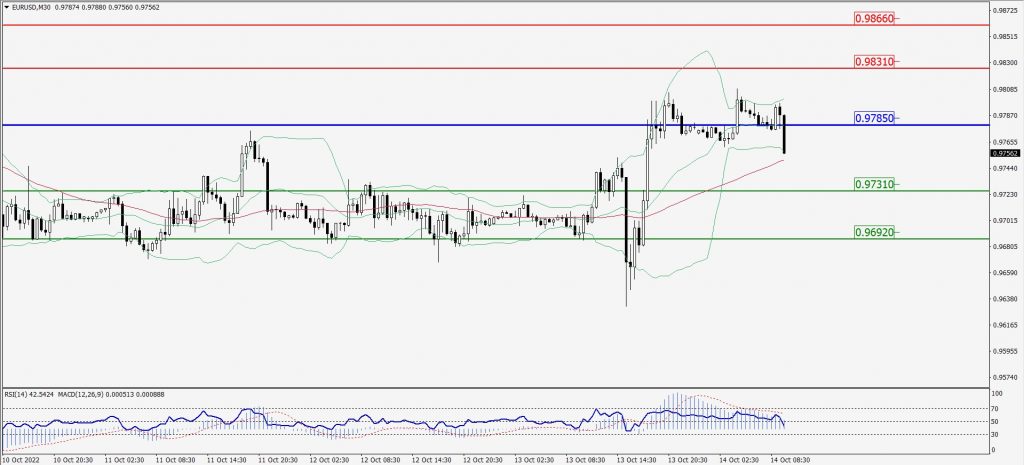
Green Lines Indicate Resistance Levels – Red Lines Indicate Support Levels
Light Blue is a Pivot Point – Black represents the price when the report was produced
GBP/USD Intraday: Trend on the downside
Our pivot point is at 1.13370
Preferable Price Action: Sell positions below pivot with targets at 1.12110 & 1.11340 in extension.
Alternative Price Action: The price above pivot would call for further upside to 1.14310 & 1.14960.
Comment: RSI below 50 levels and Pairs below 20MA.
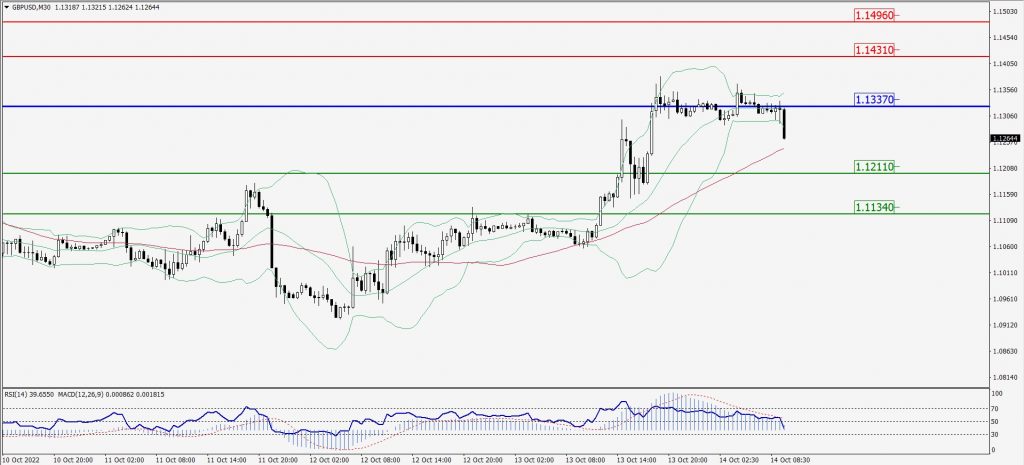
Green Lines Indicate Resistance Levels – Red Lines Indicate Support Levels
Light Blue is a Pivot Point – Black represents the price when the report was produced
USD/JPY Intraday: Trend on the upside
Our pivot point is at 147.360
Preferable Price Action: Buy position above pivot with the target at 148.110 and 148.720 in extension.
Alternative Price Action: The downside breakout of the pivot would call for 146.690 and 146.180.
Comment: MACD is positive territory and Pairs above its 20MA & 55MA.
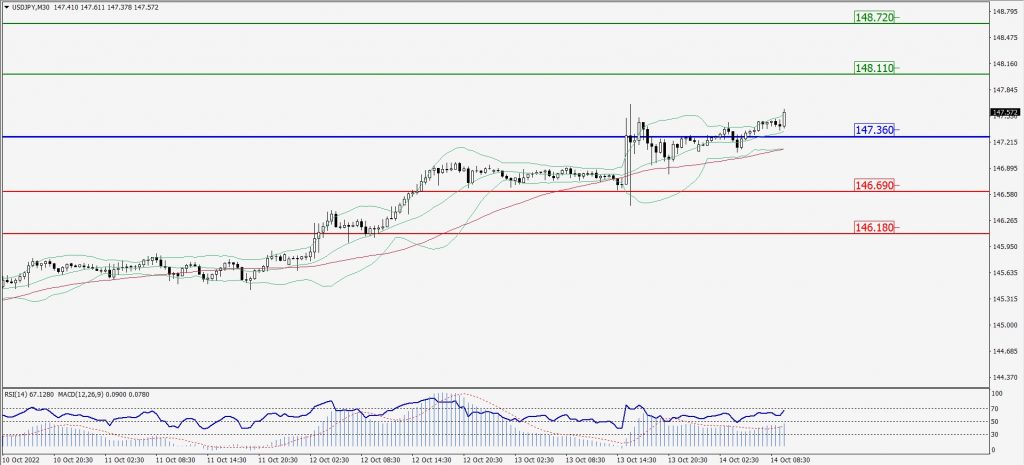
Green Lines Indicate Resistance Levels – Red Lines Indicate Support Levels
Light Blue is a Pivot Point – Black represents the price when the report was produced
AUD/USD Intraday: In a consolidation zone
Our pivot point is at 0.63440
Preferable Price Action: Sell Positions below pivot with targets at 0.62830 & 0.62410 in extension.
Alternative Price Action: Above pivot looks for a further upside with 0.63930 & 0.64350 as targets.
Comment: RSI at 50 levels and Pairs below 20MA.
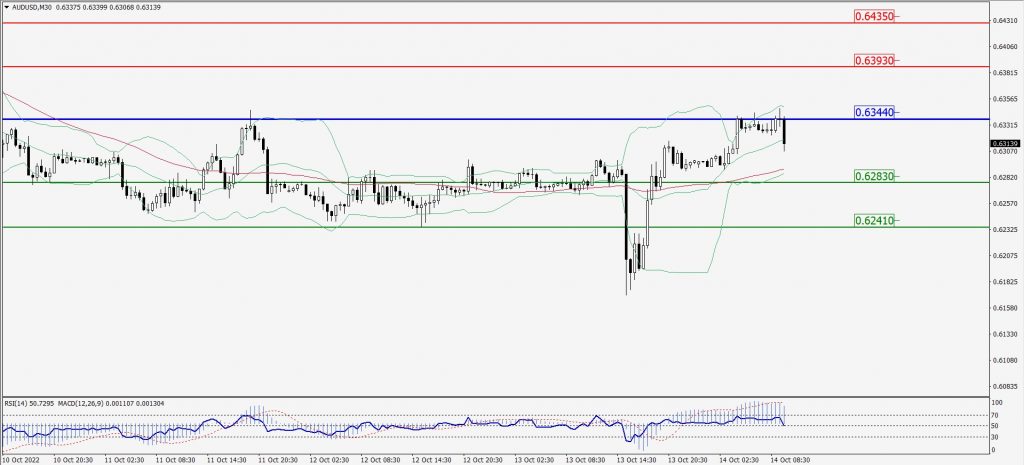
Green Lines Indicate Resistance Levels – Red Lines Indicate Support Levels
Light Blue is a Pivot Point – Black represents the price when the report was produced
CRUDEOIL Intraday: Trend on the upside
Our pivot point is at 87.78
Preferable Price Action: Above pivots buy oil with 89.62 & 90.93 as targets.
Alternative Price Action: Sell crude below pivot with targets at 86.41 and 85.08 in extension.
Comment: MACD is in the positive territory and Pairs above 55MA.
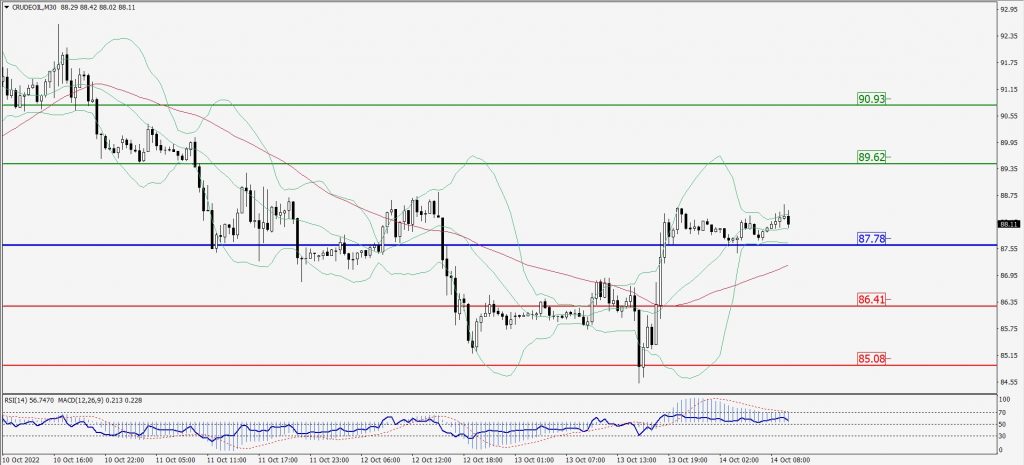
Green Lines Indicate Resistance Levels – Red Lines Indicate Support Levels
Light Blue is a Pivot Point – Black represents the price when the report was produced
XAU/USD Intraday: Trend on the downside
Our pivot point is 1670.90
Preferable Price Action: Further downside to 1653.50 and 1639.80
Alternative Price Action: If the price gives an upside breakout of a pivot, then the price extends to 1687.30 and 1701.50.
Comment: MACD is negative territory and Pairs below its 20MA & 55MA.
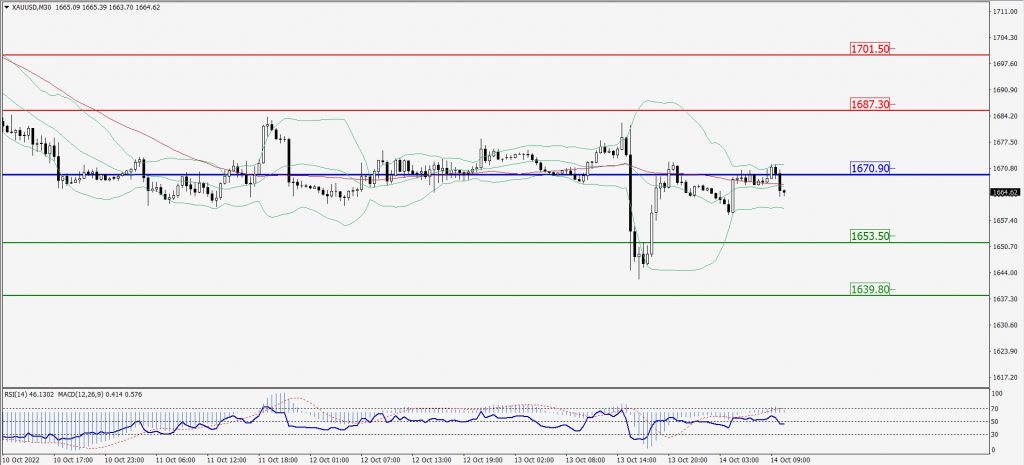
Green Lines Indicate Resistance Levels – Red Lines Indicate Support Levels
Light Blue is a Pivot Point – Black represents the price when the report was produced
Dow Jones Intraday: Trend on the upside
Our pivot point is 30,016.00
Preferable Price Action: Take buy positions above pivot with targets at 30,422.00 & 30,727.00.
Alternative Price Action: Below 30,016.00 looks for further downside to 29,655.00 & 29,361.00.
Comment: RSI above 50 levels and Pairs above 55MA.
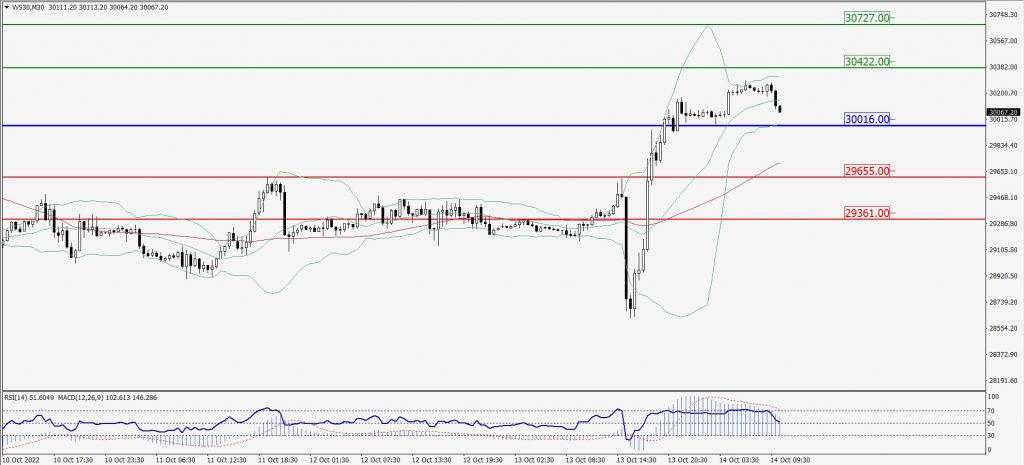
Green Lines Indicate Resistance Levels – Red Lines Indicate Support Levels
Light Blue is a Pivot Point – Black represents the price when the report was produced