Market Wrap: Stocks, Bonds, Commodities
US stocks kicked off the trading week on Monday with a rally after Britain reversed course on an economic plan, while Bank of America was the latest financial company to post solid quarterly results, which lifted optimism about the corporate earnings season.
The Dow Jones Industrial Average rose 550.99 points to 30,185.82, the S&P 500 gain 94.88 points to 3,677.95 and the Nasdaq Composite add 354.41 points to 10,675.80.
MSCI’s index of Asia-Pacific stocks outside Japan is ascend 1.30% to 551.34 levels. Australian index higher 1.72% to 6,779.20. Japanese Nikkei Index asced 1.42% to 27,156.14.
European stocks were positive on Tuesday, with the Stoxx Europe 50 Index rose 1.34% to 3,486.95, Germany’s DAX ascend 1.52% to 12,841.82, and France’s CAC up 1.16% to 6,110.67, and U.K.’s FTSE 100 surged 1.16% to 7,000.40.
Benchmark 10-year U.S. Treasury fell as demand for safe assets ascend again, today 10-year bond yields a negative 0.77% to 3.9840.
Oil prices rose slightly on Monday in choppy trading as China’s continuation of loose monetary policy was partly offset by fears that high inflation and energy costs could drag the global economy into recession.
Spot Brent crude oil add 0.46% to $92.06 per barrel. US West Texas Intermediate crude is up 0.62% to $85.22 a barrel.
The yellow metal gold is decline 0.12% to 1,661.95 dollars per ounce.
Market Wrap: Forex
The U.S. dollar edged lower in early European trading Tuesday, while sterling largely retained overnight strength as investor sentiment soared as the U.K. rowed back on its ill-fated tax-slashing mini-budget which had roiled markets.
Today, the U.S. dollar index measures the Greenback against a trade-weighted basket of six major currencies, which is fell 0.06% to 111.830.
The Euro US Dollar (EUR/USD) is a widely traded pair that is up 0.14% today. This left the pair trading around $0.98530.
The Japanese yen was positive against the U.S. dollar on Tuesday as the stock up. Today USD/JPY is drop 0.06% to 148.940 level.
Another commodity-related currency positive against the U.S dollar, AUD/USD surged 0.29% to 0.63060, and NZD/USD add 1.07 to 0.56930 level.
EUR/USD Intraday: Trend on the upside
Our pivot point is at 0.98400
Preferable Price Action: Take buy positions below pivot level with targets at 0.99000 & 0.99430 in extension.
Alternative Price Action: Below pivot looks for a further downside to 0.97870 & 0.97450.
Comment: RSI above 50 levels and Pairs above its 20MA & 55MA.
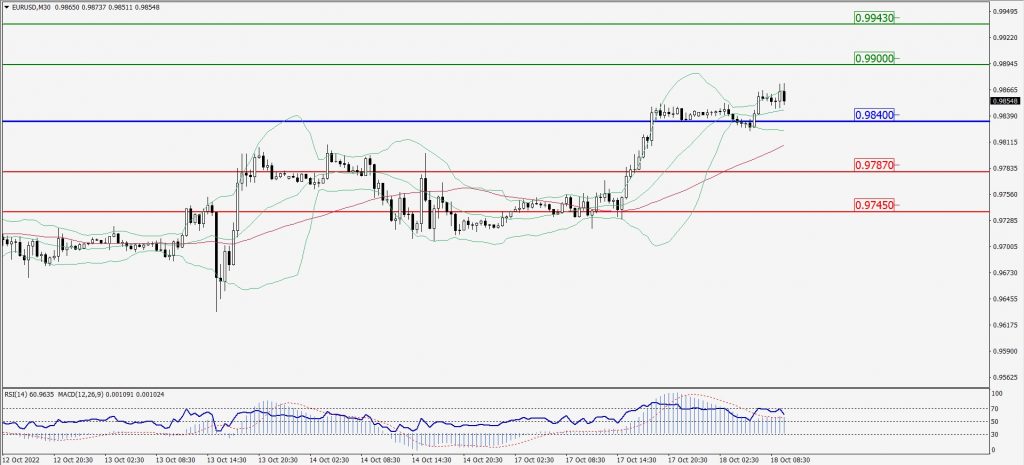
Green Lines Indicate Resistance Levels – Red Lines Indicate Support Levels
Light Blue is a Pivot Point – Black represents the price when the report was produced
GBP/USD Intraday: Trend on the downside
Our pivot point is at 1.13750
Preferable Price Action: Sell positions below pivot with targets at 1.12530 & 1.11880 in extension.
Alternative Price Action: The price above pivot would call for further upside to 1.14680 & 1.15390.
Comment: RSI below 50 levels and Pairs below 20MA.
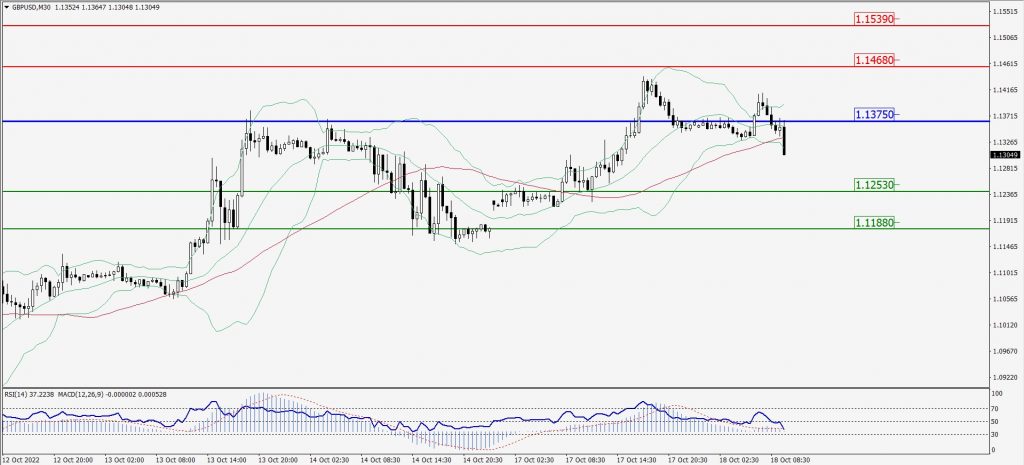
Green Lines Indicate Resistance Levels – Red Lines Indicate Support Levels
Light Blue is a Pivot Point – Black represents the price when the report was produced
USD/JPY Intraday: Support level at 148.870
Our pivot point is at 148.870
Preferable Price Action: Buy position above pivot with the target at 149.830 and 150.450 in extension.
Alternative Price Action: The downside breakout of the pivot would call for 148.080 and 147.480.
Comment: MACD is positive territory and Pairs above 55MA.
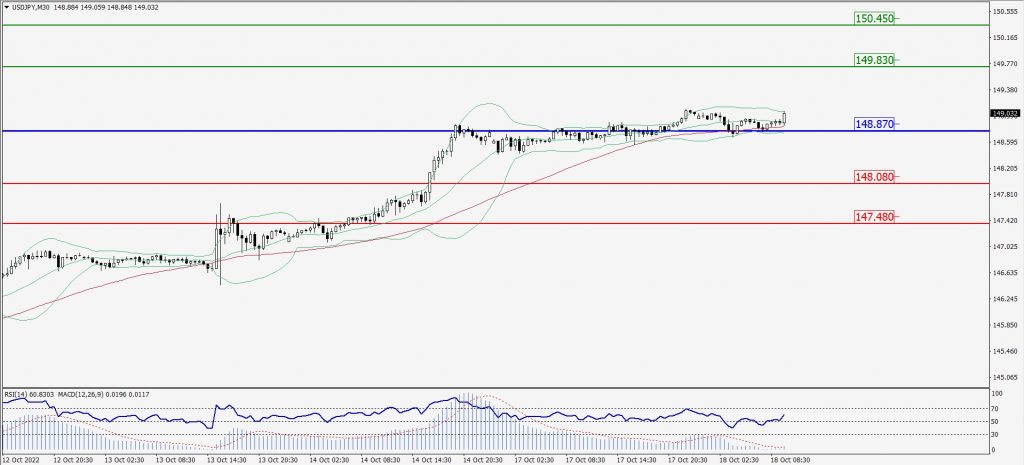
Green Lines Indicate Resistance Levels – Red Lines Indicate Support Levels
Light Blue is a Pivot Point – Black represents the price when the report was produced
AUD/USD Intraday: Resistance level at 0.63220
Our pivot point is at 0.63220
Preferable Price Action: Sell Positions below pivot with targets at 0.62670 & 0.62310 in extension.
Alternative Price Action: Above pivot looks for a further upside with 0.63770 & 0.64150 as targets.
Comment: RSI below 50 levels and Pairs below 20MA.
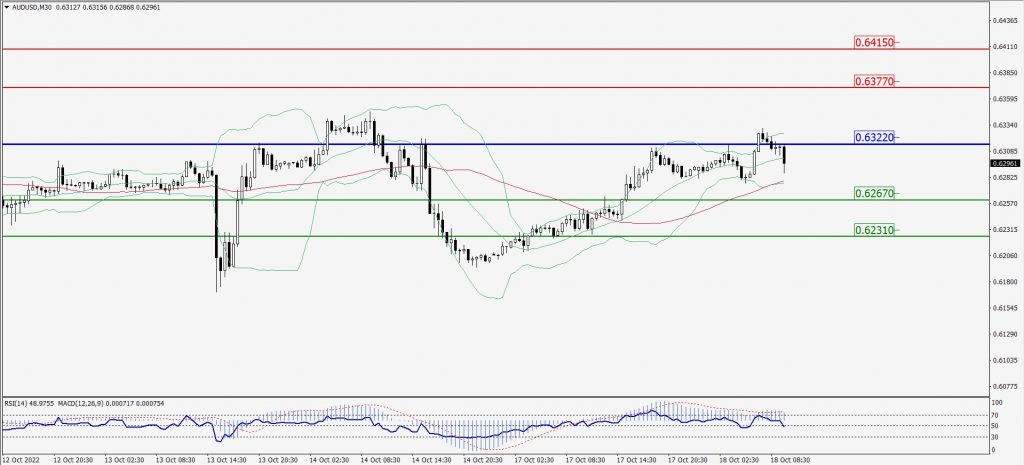
Green Lines Indicate Resistance Levels – Red Lines Indicate Support Levels
Light Blue is a Pivot Point – Black represents the price when the report was produced
CRUDEOIL Intraday: Trend on the upside
Our pivot point is at 84.77
Preferable Price Action: Above pivots buy oil with 86.32 & 87.52 as targets.
Alternative Price Action: Sell crude below pivot with targets at 83.29 and 82.23 in extension.
Comment: MACD is in the positive territory and Pairs above its 20MA & 55MA.
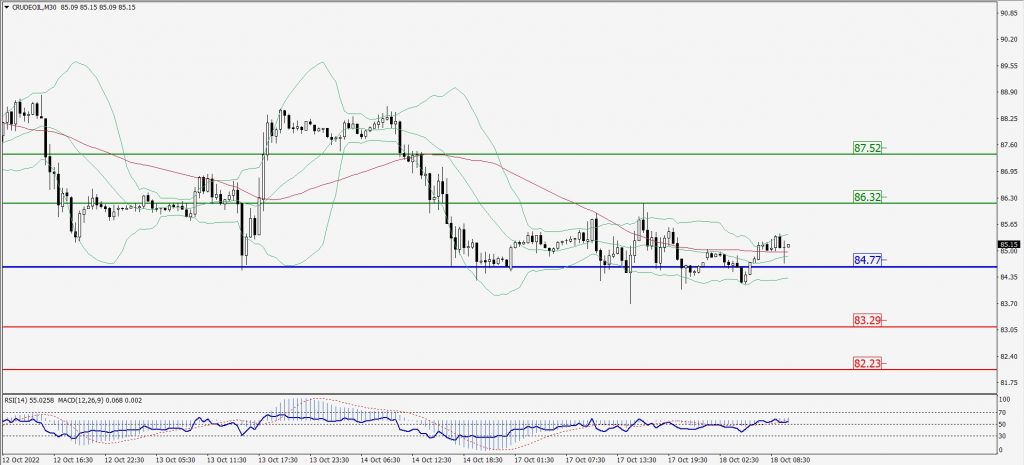
Green Lines Indicate Resistance Levels – Red Lines Indicate Support Levels
Light Blue is a Pivot Point – Black represents the price when the report was produced
XAU/USD Intraday: In a consolidation zone
Our pivot point is 1660.50
Preferable Price Action: Further downside to 1649.20 and 1640.40
Alternative Price Action: If the price gives an upside breakout of a pivot, then the price extends to 1670.00 and 1677.60.
Comment: MACD is flat territory and Pairs at 20MA.
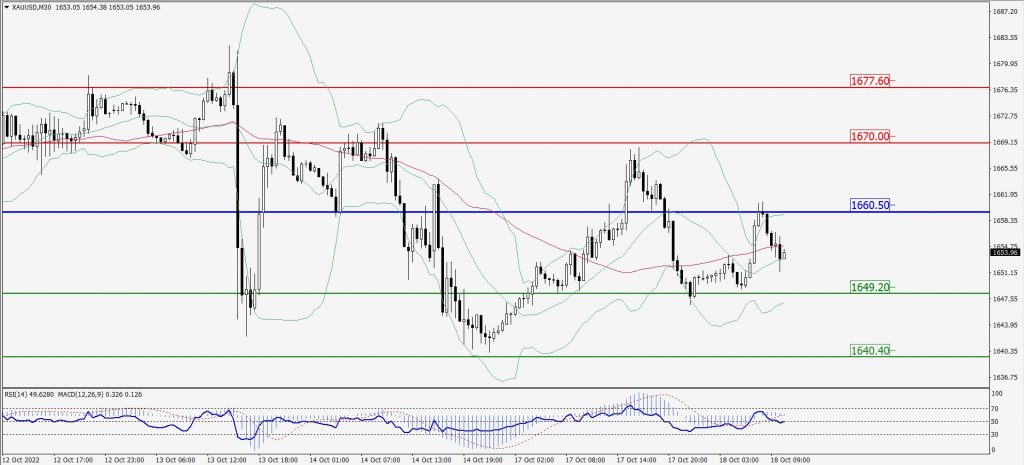
Green Lines Indicate Resistance Levels – Red Lines Indicate Support Levels
Light Blue is a Pivot Point – Black represents the price when the report was produced
Dow Jones Intraday: Major trend on the upside
Our pivot point is 30,476.00
Preferable Price Action: Take buy positions above pivot with targets at 31,033.00 & 31,421.00.
Alternative Price Action: Below 30,476.00 looks for further downside to 30,011.00 & 29,650.00.
Comment: RSI above 50 levels and Pairs above its 20MA & 55MA.
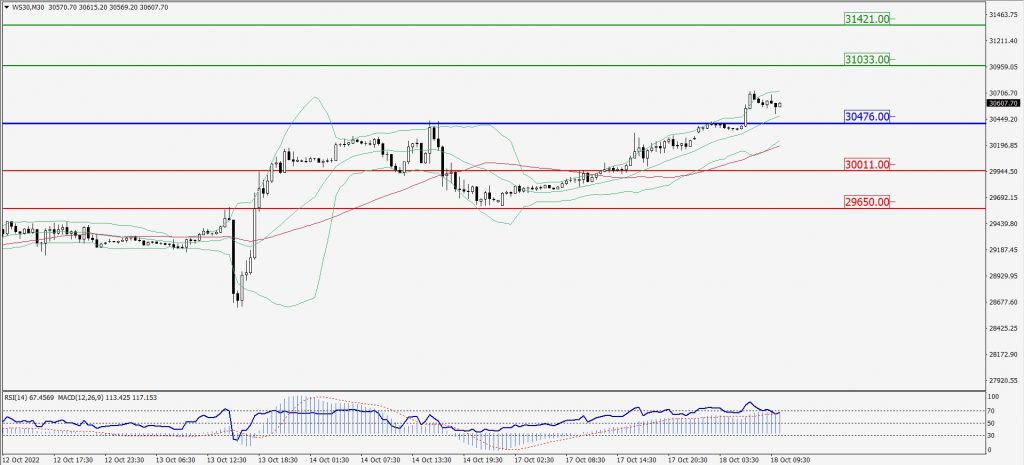
Green Lines Indicate Resistance Levels – Red Lines Indicate Support Levels
Light Blue is a Pivot Point – Black represents the price when the report was produced