Market Wrap: Stocks, Bonds, Commodities
Wall Street surged on Friday to end higher, closing the book on a week of wild market gyrations as relief at signs of peaking inflation vied with fears that policy tightening by the Federal Reserve could tilt the economy into recession.
The S&P 500 gain (2.39%) ended at 4,023.89 points, while the Nasdaq Composite up 3.82% to 11,805.00. The Dow Jones Industrial was rose 1.47% to 32,196.66.
MSCI’s index of Asia-Pacific stocks outside Japan is ascend 0.02% to 641.02 levels. Australian index higher 0.25% to 7,093.10. Japanese Nikkei Index ascend 0.45% to 26,547.05.
European stocks were negative on Monday, with the Stoxx Europe 50 Index lose 0.56% to 3,682.55, Germany’s DAX drop 0.62% to 13,942.12, and France’s CAC down 0.57% to 6,326.65, and U.K.’s FTSE 100 decrease 0.03% to 7,413.57.
Benchmark 10-year U.S. Treasury fell as demand for safe assets ascend again, today 10-year bond yields a negative 2.9260.
Oil prices rose about 4 percent on Friday as US gasoline prices jumped to a record high, China looked ready to ease pandemic restrictions and investors worried supplies will tighten if the European Union bans Russian oil.
Spot Brent crude oil fell 1.46% to $109.92 per barrel. US West Texas Intermediate crude is down 1.20% to $107.33 a barrel.
The yellow metal gold is drop 0.93% to 1,793.20 dollars per ounce.
Market Wrap: Forex
The U.S. dollar held firm in early European trade Monday, just off a 20-year high as traders sought out this safe haven amid concerns of slowing global growth and rising geopolitical tensions.
Today, the U.S. dollar index measures the Greenback against a trade-weighted basket of six major currencies, which is a rose of 0.01% to 104.639.
The Euro US Dollar (EUR/USD) is a widely traded pair that is up 0.04% today. This left the pair trading around $1.04080.
The Japanese yen was positive against the U.S. dollar on Monday as the stock up. Today USD/JPY is gain 0.15% to 129.380 level.
Another commodity-related currency negative against the U.S dollar, AUD/USD drop 0.54 to 0.69030, and NZD/USD lower 0.41% to 0.62570 level.
EUR/USD Intraday: In a Consolidation Zone
Our pivot point is at 1.03940
Preferable Price Action: Take buy positions above pivot level with targets at 1.04870 & 1.05690 in extension.
Alternative Price Action: Below pivot looks for a further downside to 1.03070 & 1.02440.
Comment: RSI above 50 levels and Pair above 55MA.
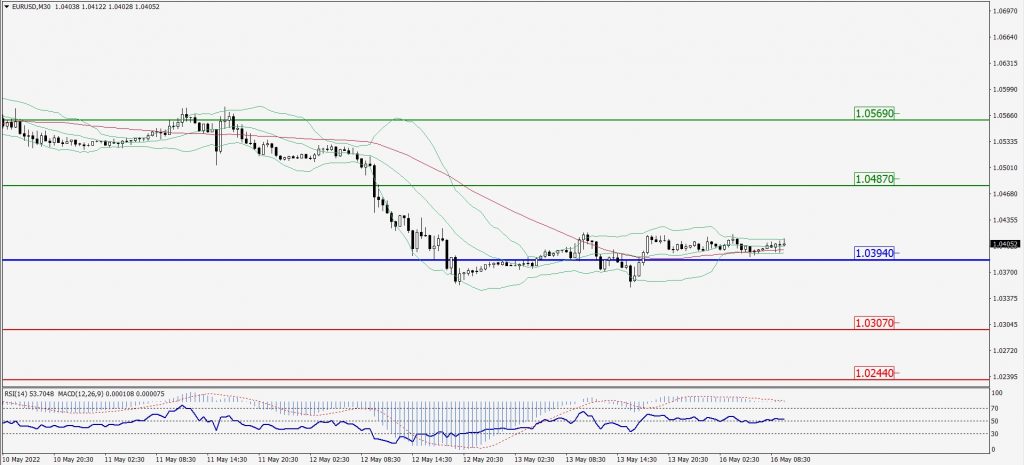
Green Lines Indicate Resistance Levels – Red Lines Indicate Support Levels
Light Blue is a Pivot Point – Black represents the price when the report was produced
GBP/USD Intraday: Major Resistance Level at 1.22600
Our pivot point is at 1.22600
Preferable Price Action: Sell positions below pivot with targets at 1.21400 & 1.20700 in extension.
Alternative Price Action: The price above pivot would call for further upside to 1.23600 & 1.24390.
Comment: RSI below 50 levels pair below 20MA.
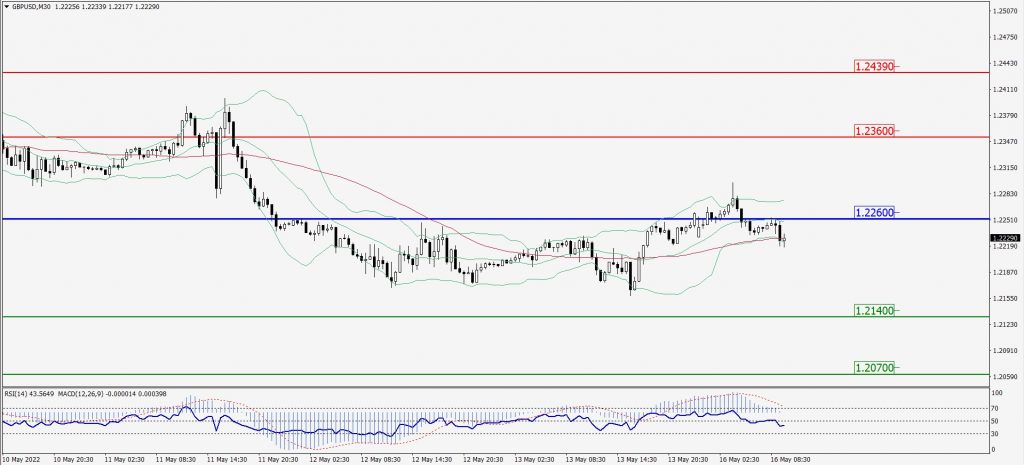
Green Lines Indicate Resistance Levels – Red Lines Indicate Support Levels
Light Blue is a Pivot Point – Black represents the price when the report was produced
USD/JPY Intraday: Major Resistance Level at 129.580
Our pivot point is at 129.580
Preferable Price Action: Sell position below pivot with the target at 127.980 and 126.750 in extension.
Alternative Price Action: The upside breakout of the pivot would call for 131.010 and 132.280.
Comment: MACD is negative territory and pair below its 20MA & 55MA.
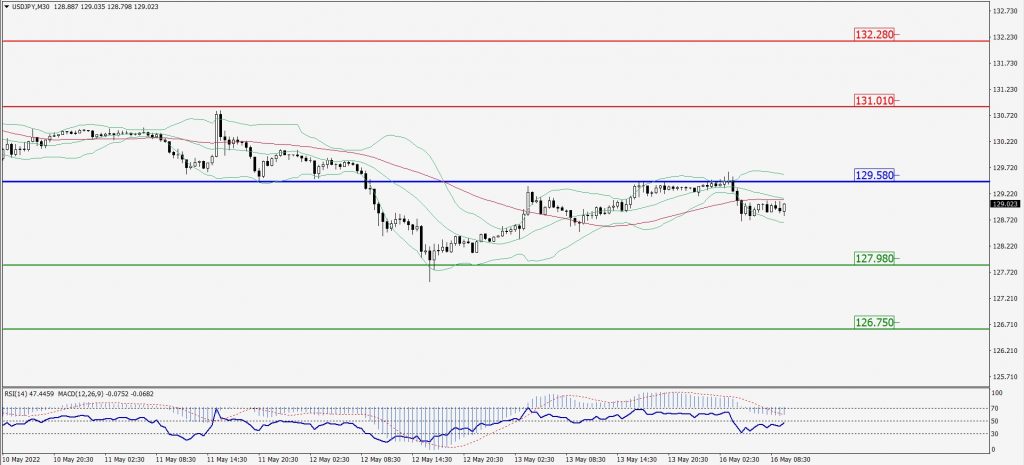
Green Lines Indicate Resistance Levels – Red Lines Indicate Support Levels
Light Blue is a Pivot Point – Black represents the price when the report was produced
AUD/USD Intraday: Maj0r Support Level at 0.68930
Our pivot point is at 0.68930
Preferable Price Action: Buy Positions above pivot with targets at 0.70040 & 0.70890 in extension.
Alternative Price Action: Below pivot looks for a further downside with 0.68060 & 0.67240 as targets.
Comment: RSI at 50 levels and Pair at 20MA & 55MA.
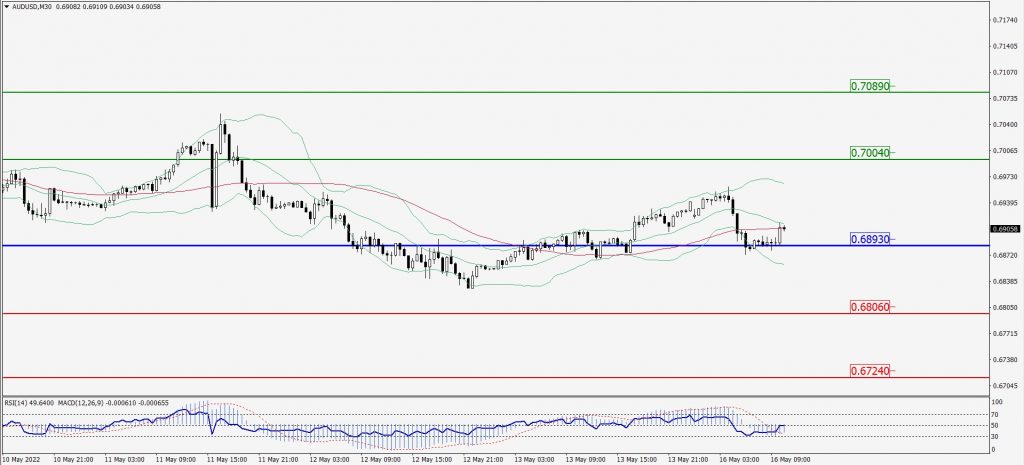
Green Lines Indicate Resistance Levels – Red Lines Indicate Support Levels
Light Blue is a Pivot Point – Black represents the price when the report was produced
CRUDEOIL Intraday: Trend on The Upside
Our pivot point is at 107.07
Preferable Price Action: Above pivots Buy oil with 112.72 & 116.63 as targets.
Alternative Price Action: Sell crude below pivot with targets at 101.61 and 97.55 in extension.
Comment: MACD is in the positive territory and Pair above 55MA.
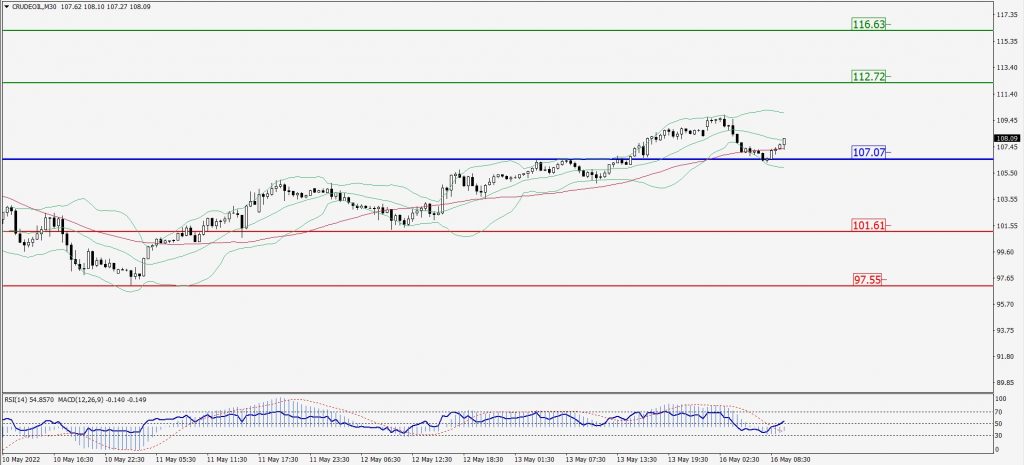
Green Lines Indicate Resistance Levels – Red Lines Indicate Support Levels
Light Blue is a Pivot Point – Black represents the price when the report was produced
XAU/USD Intraday: Trend on The Downside
Our pivot point is 1819.00
Preferable Price Action: Further downside to 1785.50 and 1760.40.
Alternative Price Action: If the price gives an upside breakout of a pivot, then the price extends to 1849.80 and 1875.60.
Comment: MACD is negative territory and pair below its 20MA & 55MA.
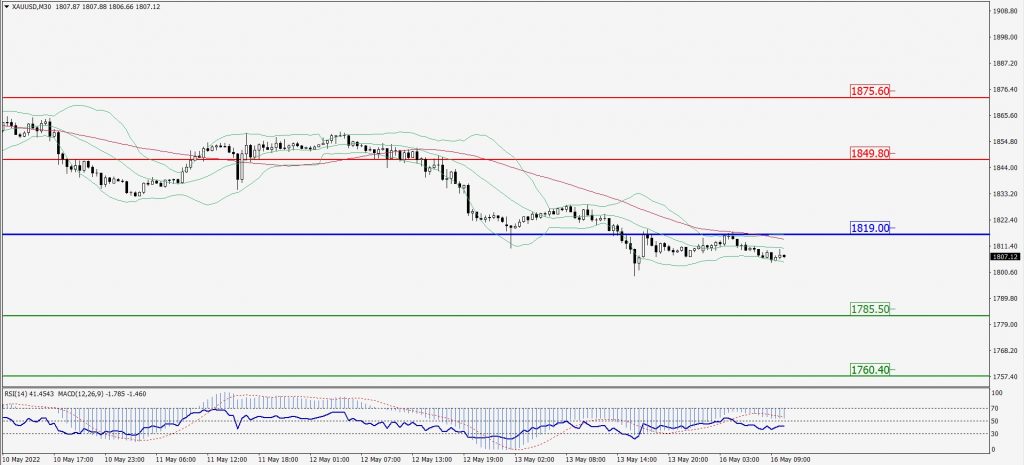
Green Lines Indicate Resistance Levels – Red Lines Indicate Support Levels
Light Blue is a Pivot Point – Black represents the price when the report was produced
Dow Jones Intraday: In a Consolidation Zone
Our pivot point is 31,968.00
Preferable Price Action: Take Buy positions above pivot with targets at 32,388.00 & 32,851.00.
Alternative Price Action: Below 31,968.00 looks for further downside to 31,551.00 & 31,137.00.
Comment: RSI at 50 levels.
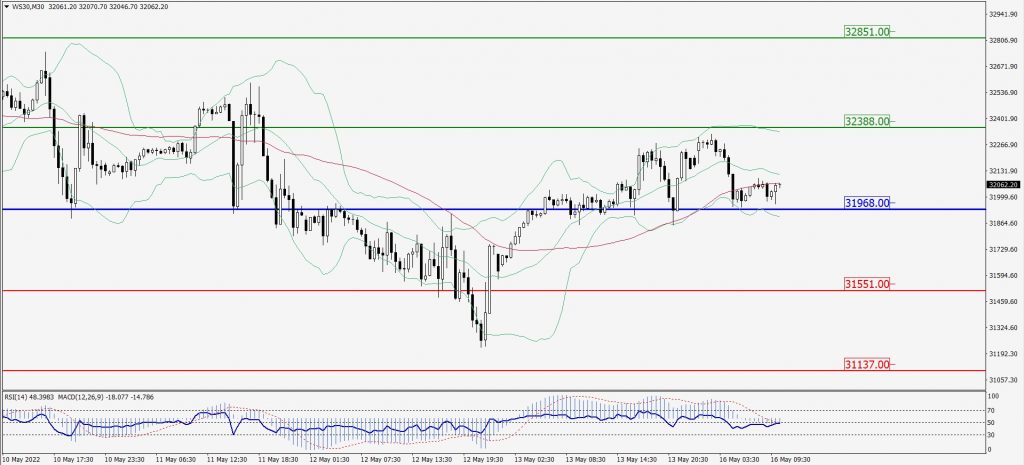
Green Lines Indicate Resistance Levels – Red Lines Indicate Support Levels
Light Blue is a Pivot Point – Black represents the price when the report was produced