Market Wrap: Stocks, Bonds, Commodities
Most Asian currencies moved little on Tuesday, while the dollar caught some safe haven bids after the attempted assassination of former U.S. President Donald Trump over the weekend.
The Dow Jones Industrial Average rose 210.82 points to 40,211.72, the S&P 500 gain 0.28% to 5,631.22 and the Nasdaq Composite ascend 77.41 points to 18,475.86.
MSCI’s index of Asia-Pacific stocks outside Japan is down 0.34% to 715.14 levels. The Australian index was lower by 0.23% to 7,999.30. Japanese Nikkei Index increase 0.22% today.
European stocks were negative on Tuesday, with the Stoxx Europe 50 Index decrease 0.72% to 4,947.15, Germany’s DAX descend 0.58% to 18,493.15, and France’s CAC lower 0.68% to 7,580.55 and U.K.’s FTSE 100 loss 0.41% to 8,149.21.
Benchmark 10-year U.S. Treasury rose as demand for safe assets slipped again, today 10-year bond yields decrease 0.31% to 4.1740.
Oil prices dipped on Tuesday on worries of a slowing Chinese economy crimping demand and despite a growing consensus the U.S. Federal Reserve could begin cutting its key interest rate as soon as September.
Spot Brent crude oil decrease 0.81% to $84.16 per barrel. US West Texas Intermediate crude is decrease 0.89% to $80.12 a barrel.
The yellow metal gold is up 0.57% to 2,442.70 dollars per ounce.
Market Wrap: Forex
Most Asian currencies moved in a flat-to-low range on Tuesday as speculation over a Donald Trump presidency helped the dollar rise past increased bets on interest rate cuts.
Today, the U.S. dollar index measures the Greenback against a trade-weighted basket of six major currencies, which increase 0.08% to 103.9670.
The Euro US Dollar (EUR/USD) is a widely traded pair that is ascend 0.06% today. This left the pair trading around $1.09010.
The Japanese yen was will move positive against the U.S. dollar on Monday. Today USD/JPY is trades pair that increase 0.33% to the 158.540 level.
Another commodity-related currency negative against the U.S dollar, AUD/USD decrease 0.30% to 0.67390, and NZD/USD decrease 0.21% to 0.60600 level.
EUR/USD Intraday: Trend on the downside
Our pivot point is at 1.08920
Preferable Price Action: Take sell positions below pivot level with targets at 1.08770 & 1.08640 in extension.
Alternative Price Action: Buy pivot looks for a further upside to 1.09070 & 1.09210.
Comment: RSI is below 50 levels and Pairs below its 20MA & 50MA.
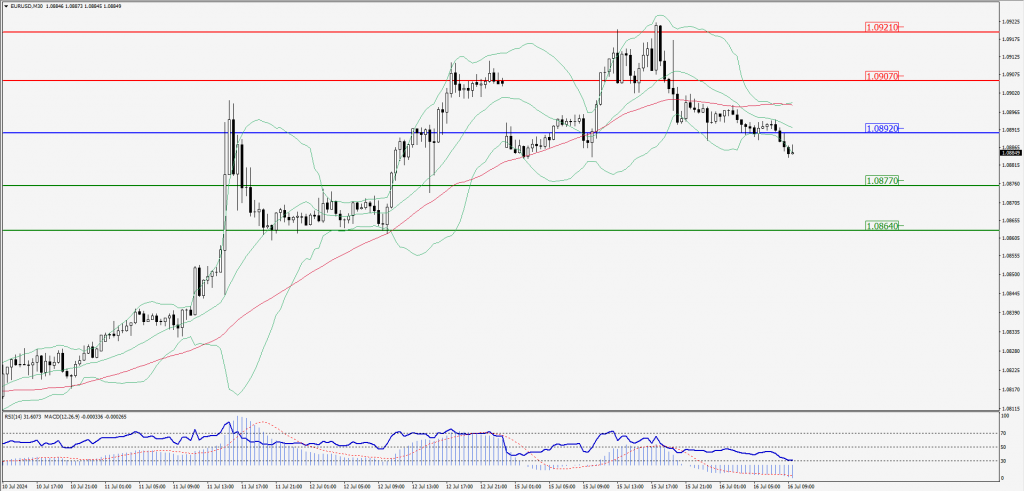
Green Lines Indicate Resistance Levels – Red Lines Indicate Support Levels
Light Blue is a Pivot Point – Black represents the price when the report was produced
GBP/USD Intraday: Trend on the downside
Our pivot point is at 6590
Preferable Price Action: Sell positions below pivot with targets at 1.29300 & 1.29000 in extension.
Alternative Price Action: The price above pivot would call for further upside to 1.30010 & 1.30300.
Comment: RSI is below 50 levels and Pairs below its 20MA & 55MA.
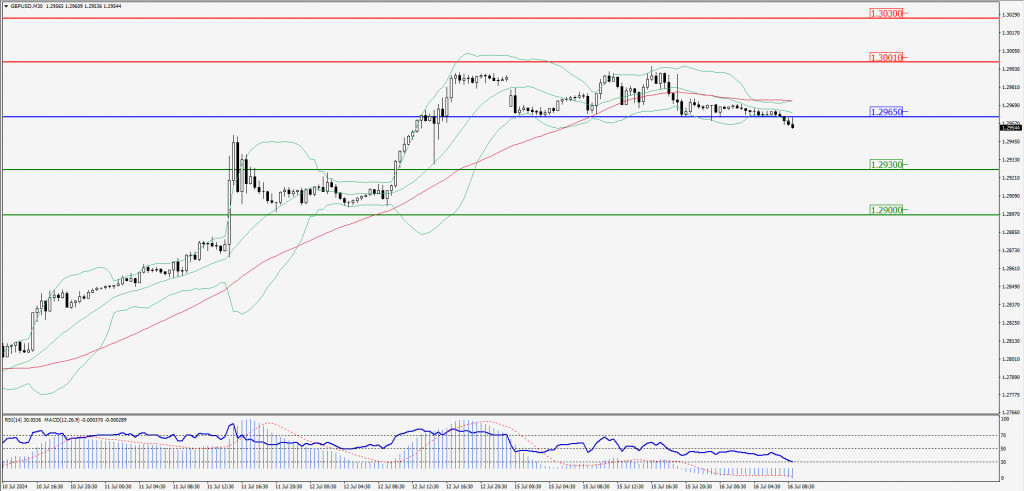
Green Lines Indicate Resistance Levels – Red Lines Indicate Support Levels
Light Blue is a Pivot Point – Black represents the price when the report was produced
USD/JPY Intraday: Trend on the upside
Our pivot point is at 158.390
Preferable Price Action: Buy position above pivot with the target at 159.000 and 159.560 in extension.
Alternative Price Action: The downside breakout of the pivot would call for 157.770 and 157.230.
Comment: MACD is above 50 levels Pairs above its 55MA.
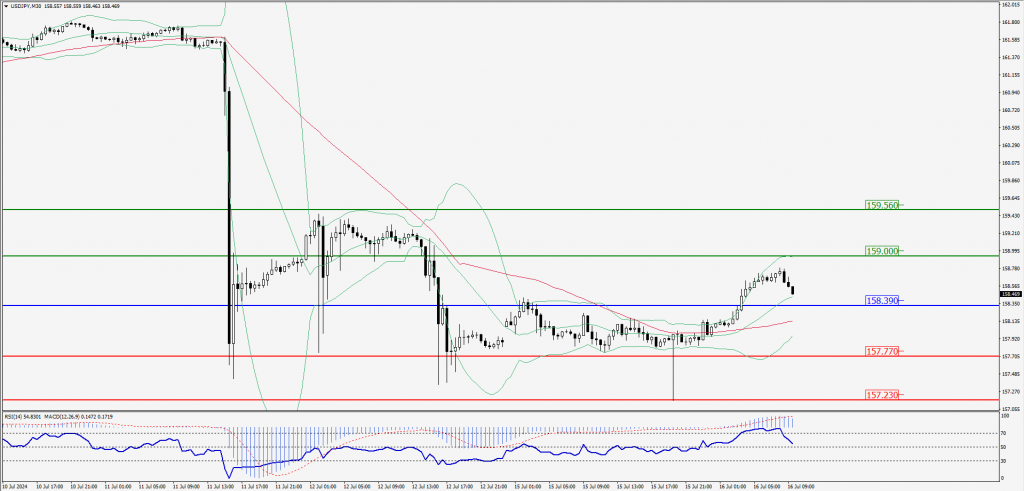
Green Lines Indicate Resistance Levels – Red Lines Indicate Support Levels
Light Blue is a Pivot Point – Black represents the price when the report was produced
AUD/USD Intraday: Trend on the downside
Our pivot point is at 0.67430
Preferable Price Action: Sell positions below pivot with targets at 0.67320 & 0.67240 in extension.
Alternative Price Action: Above pivot a further upside with 0.67530 & 0.67620 as targets.
Comment: RSI is below 50 levels and Pairs below its 55MA & 20MA.
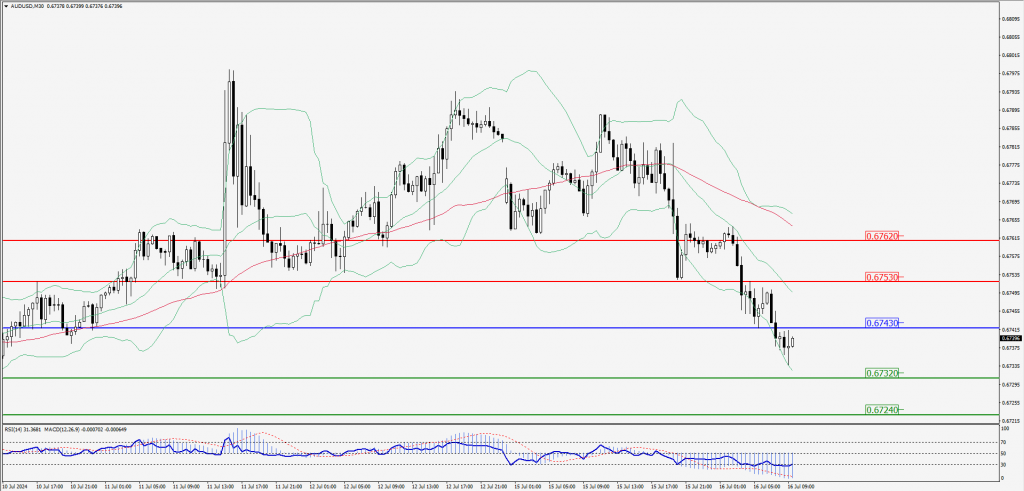
Green Lines Indicate Resistance Levels – Red Lines Indicate Support Levels
Light Blue is a Pivot Point – Black represents the price when the report was produced
CRUDEOIL Intraday: Major trend on the downside
Our pivot point is at 80.46
Preferable Price Action: Below pivot sell oil with 79.99 & 79.61 as targets.
Alternative Price Action: Buy crude above pivot with targets at 80.94 and 81.31 in extension.
Comment: RSI is below 50 levels and pairs below its 20MA & 55MA.
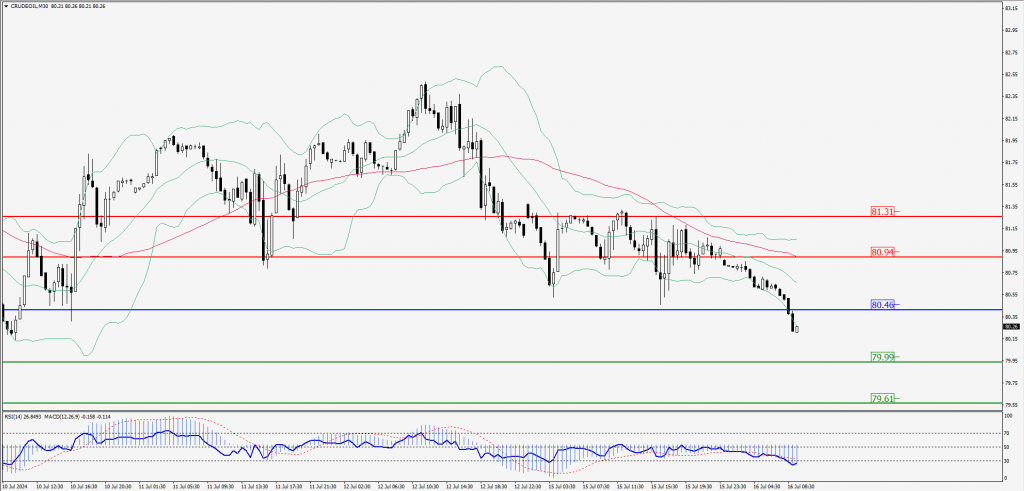
Green Lines Indicate Resistance Levels – Red Lines Indicate Support Levels
Light Blue is a Pivot Point – Black represents the price when the report was produced
XAU/USD Intraday: Trend on the upside
Our pivot point is 2428.70
Preferable Price Action: Further upside to 2440.00 and 2450.90.
Alternative Price Action: If the price gives an downside breakout of a pivot, then the price extends to 2417.20 and 2406.60.
Comment: MACD is above 50 levels and Pairs above its 20MA & 55MA.
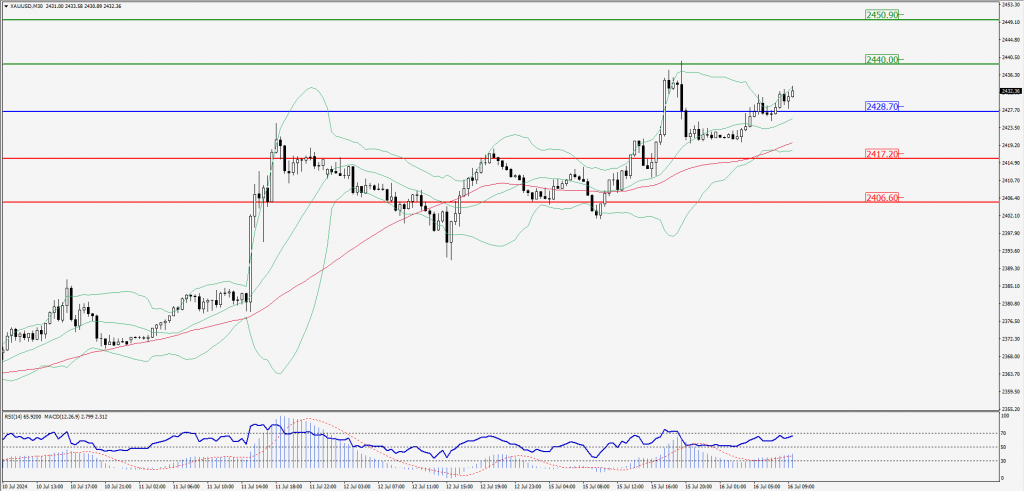
Green Lines Indicate Resistance Levels – Red Lines Indicate Support Levels
Light Blue is a Pivot Point – Black represents the price when the report was produced
Dow Jones Intraday: Trend on the downside
Our pivot point is 40,300.90
Preferable Price Action: Take sell positions below the pivot with targets at 40,141.20 & 40,000.90.
Alternative Price Action: Above 40,067.50 looks for further upside to 40,458.40 & 40,607.30.
Comment: RSI is below 50 levels and pairs below its 20MA.
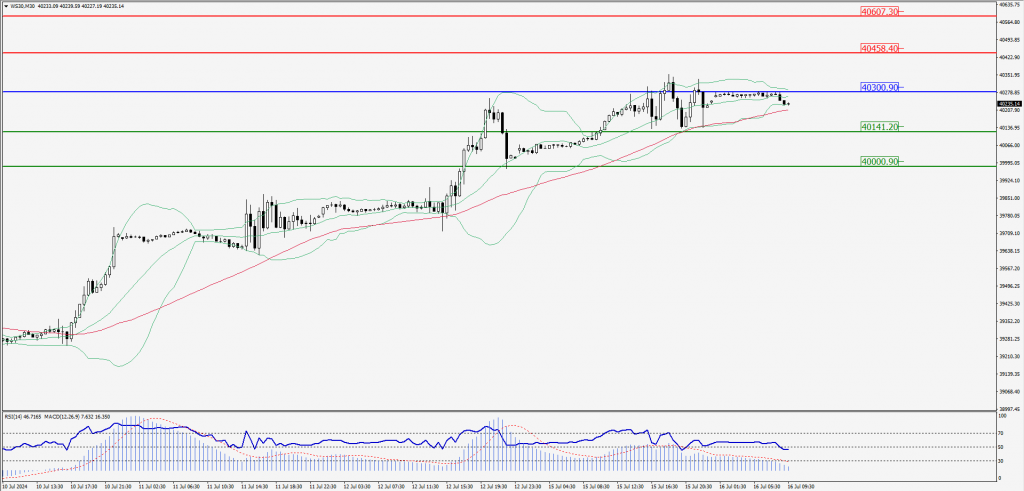
Green Lines Indicate Resistance Levels – Red Lines Indicate Support Levels
Light Blue is a Pivot Point – Black represents the price when the report was produced