Market Wrap: Stocks, Bonds, Commodities
Asian currencies were largely subdued on Tuesday as markets were cautious ahead of interest rate decisions from major central banks, including the U.S. Federal Reserve.
The Dow Jones Industrial Average fail 110.58 points to 43,717.48, the S&P 500 gain 0.38% to 6,074.08 and the Nasdaq Composite up 247.17 points to 20,173.89.
MSCI’s index of Asia-Pacific stocks outside Japan is down 1.11% to 714.11 levels. The Australian index was Higher by 0.78% to 8,314.00. Japanese Nikkei Index decrease 0.13% today.
European stocks were mixed on Tuesday, with the Stoxx Europe 50 Index decrease 0.30% to 4,932.15 Germany’s DAX ascend 0.02% to 20,317.95, and France’s CAC lower 0.46% to 7,322.96 and U.K.’s FTSE 100 loss 0.77% to 8,198.76.
Benchmark 10-year U.S. Treasury rose as demand for safe assets slipped again, today 10-year bond yields 0.35% to 4.4150.
Oil prices eased further on Tuesday as China’s economic data renewed demand concerns, while investors remained cautious ahead of the U.S. Federal Reserve’s interest rate decision.
Spot Brent crude oil decrease 0.32% to $73.67 per barrel. US West Texas Intermediate crude is decrease 0.96% to $70.03 a barrel.
The yellow metal gold is down 0.02% to 2,669.49 dollars per ounce.
Market Wrap: Forex
The US Dollar Index was largely steady in Asia hours on Tuesday, while the US Dollar Index Futures were marginally higher.
Today, the U.S. dollar index measures the Greenback against a trade-weighted basket of six major currencies, which either ascend 0.10% to 106.660.
The Euro US Dollar (EUR/USD) is a widely traded is down 0.11% today. This left the pair trading around $1.04990.
The Japanese yen was will move negative against the U.S. dollar on Tuesday. Today USD/JPY is trades pair that decrease 0.04% to the 154.09 level.
Another commodity-related currency negative against the U.S dollar, AUD/USD loss 0.33% to 0.63490, and NZD/USD decrease 0.32% to 0.57620 level.
EUR/USD Intraday: Trend on the upside
Our pivot point is at 1.05040
Preferable Price Action: Take buy positions above pivot level with targets at 1.05150 & 1.05240 in extension.
Alternative Price Action: Sell pivot looks for a further downside to 1.04930 & 1.04840.
Comment: RSI is above 50 levels.
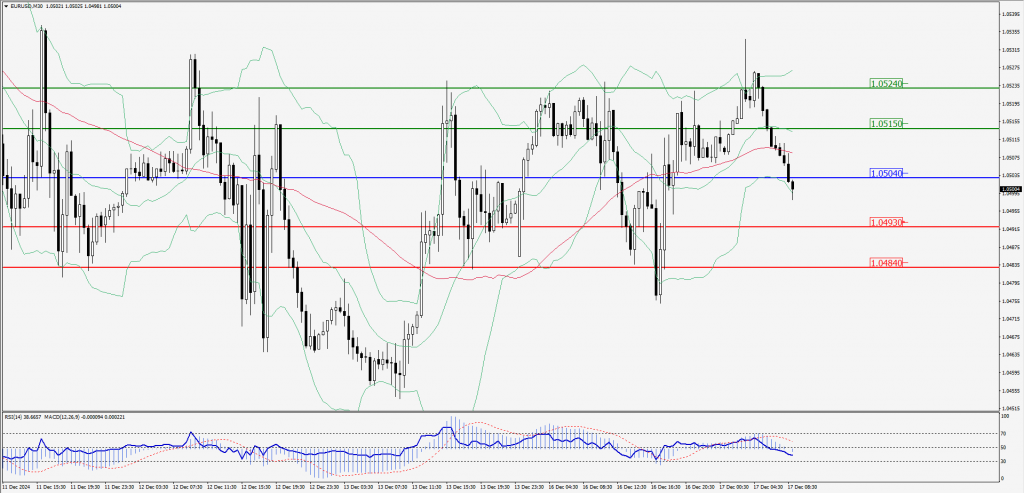
Green Lines Indicate Resistance Levels – Red Lines Indicate Support Levels
Light Blue is a Pivot Point – Black represents the price when the report was produced
GBP/USD Intraday: Trend on the downside
Our pivot point is at 1.26810
Preferable Price Action: Sell positions below pivot with targets at 1.26500 & 1.26230 in extension.
Alternative Price Action: The price above pivot would call for further upside to 1.27110 & 1.27390.
Comment: RSI is below 50 levels and pairs below its 20MA.
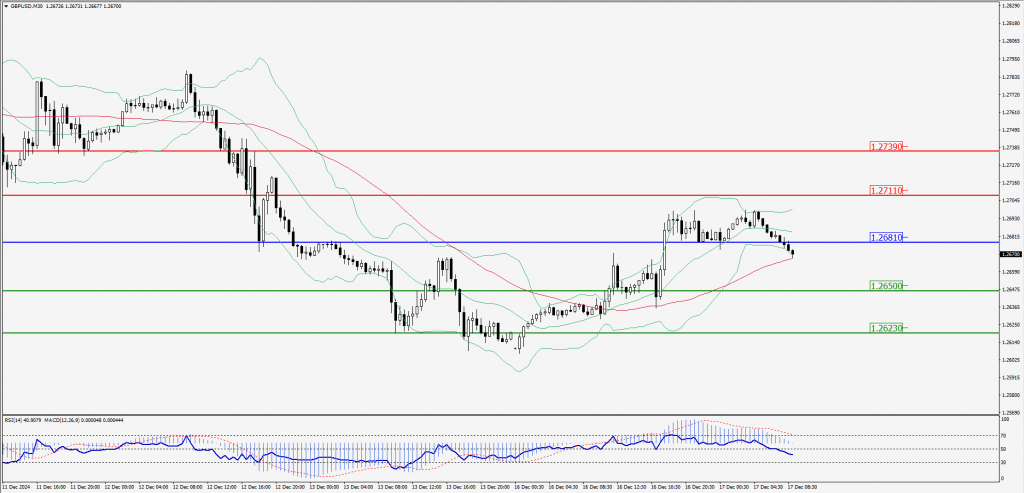
Green Lines Indicate Resistance Levels – Red Lines Indicate Support Levels
Light Blue is a Pivot Point – Black represents the price when the report was produced
USD/JPY Intraday: Trend on the upside
Our pivot point is at 154.020
Preferable Price Action: Buy position above pivot with the target at 154.380 and 154.680 in extension.
Alternative Price Action: The downside breakout of the pivot would call for 153.650 and 153.320.
Comment: MACD is above 50 levels and pairs above its 55MA.
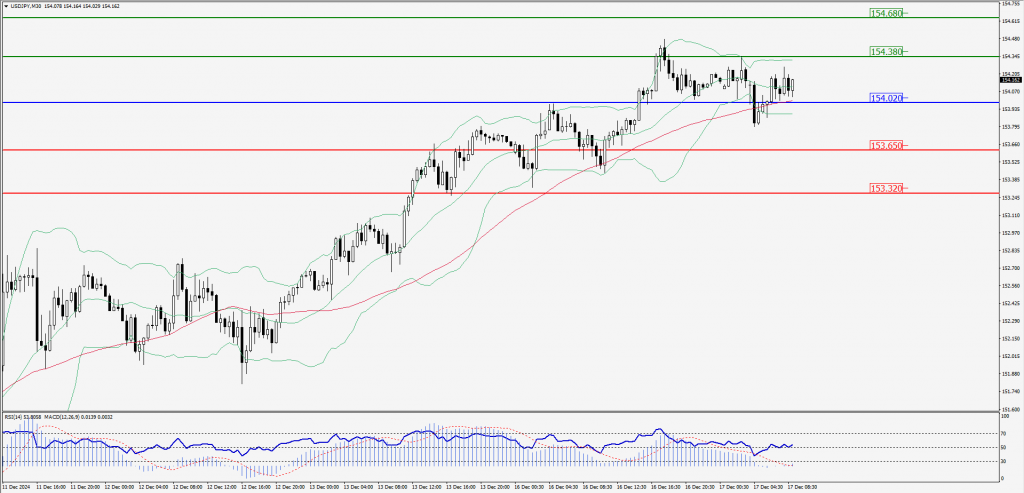
Green Lines Indicate Resistance Levels – Red Lines Indicate Support Levels
Light Blue is a Pivot Point – Black represents the price when the report was produced
AUD/USD Intraday: Trend on the downside
Our pivot point is at 0.63520
Preferable Price Action: Sell positions below pivot with targets at 0.63370 & 0.63240 in extension.
Alternative Price Action: Above pivot a further upside with 0.63680 & 0.63810 as targets.
Comment: RSI is below 50 levels and pairs below its 55MA & 20MA.
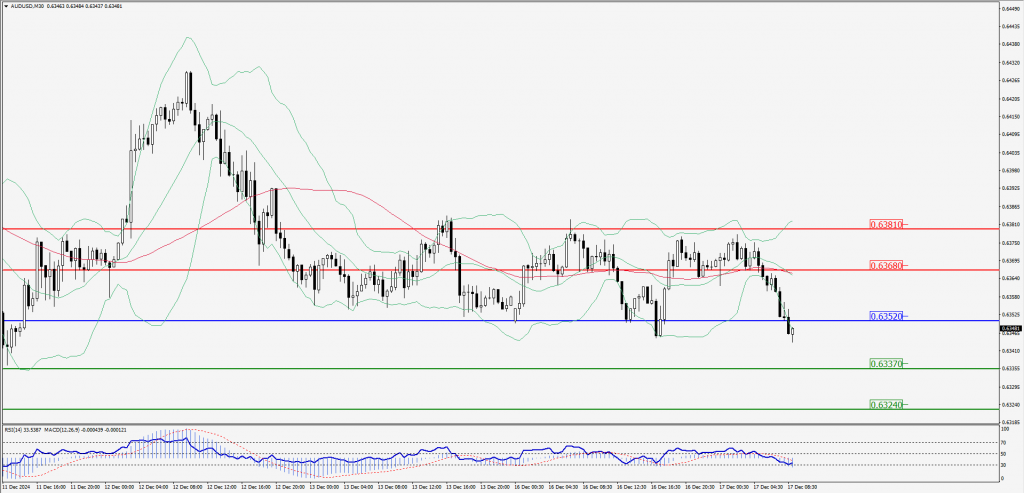
Green Lines Indicate Resistance Levels – Red Lines Indicate Support Levels
Light Blue is a Pivot Point – Black represents the price when the report was produced
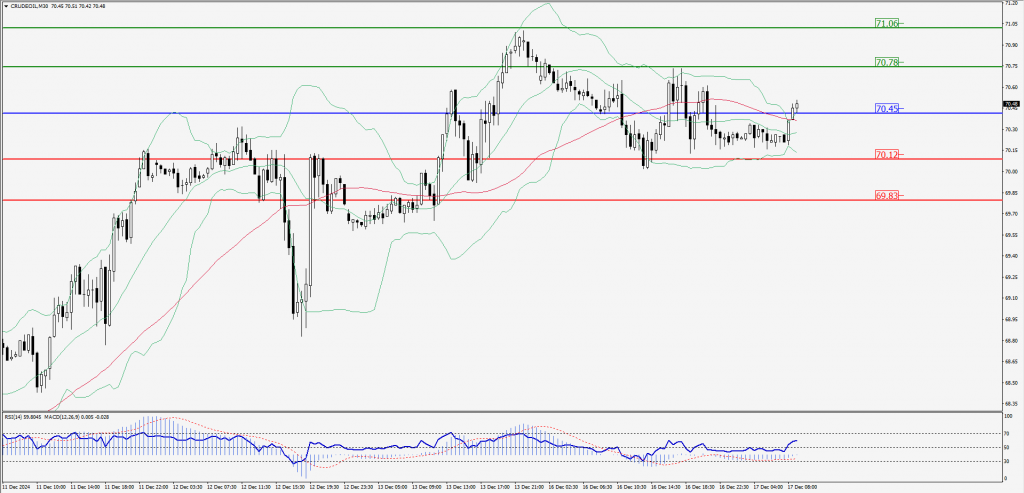
CRUDEOIL Intraday: Trend on the upside
Our pivot point is at 70.45
Preferable Price Action: Above pivot buy oil with 70.78 & 71.06 as targets.
Alternative Price Action: Sell crude below pivot with targets at 70.12 & 69.83 in extension.
Comment: RSI is at above 50 levels and pairs above its 20MA.
Green Lines Indicate Resistance Levels – Red Lines Indicate Support Levels
Light Blue is a Pivot Point – Black represents the price when the report was produced
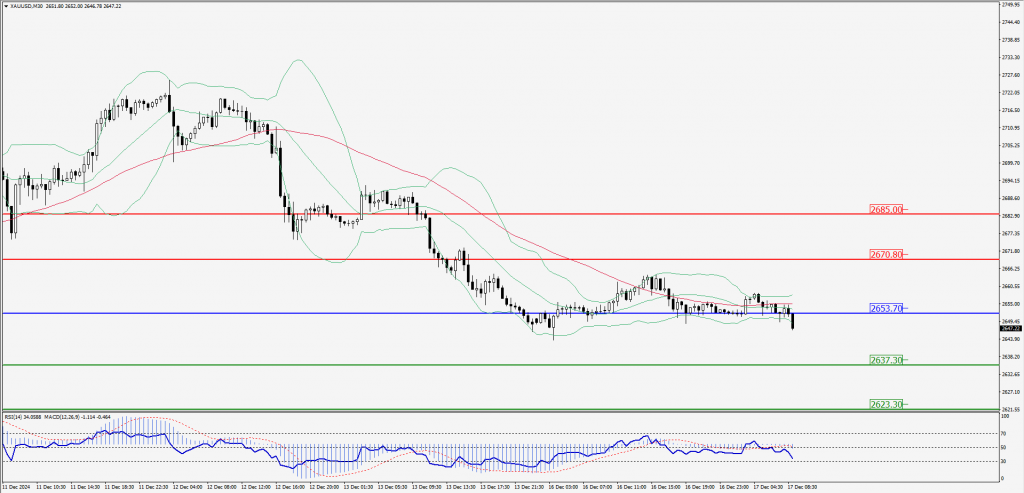
XAU/USD Intraday: Trend on the downside
Our pivot point is at 2653.70
Preferable Price Action: Further downside to 2637.30 and 2623.30.
Alternative Price Action: If the price gives an upside breakout of a pivot, then the price extends to 2670.80 and 2685.00.
Comment: MACD is below 50 levels and pairs below its 55MA & 20MA.
Green Lines Indicate Resistance Levels – Red Lines Indicate Support Levels
Light Blue is a Pivot Point – Black represents the price when the report was produced
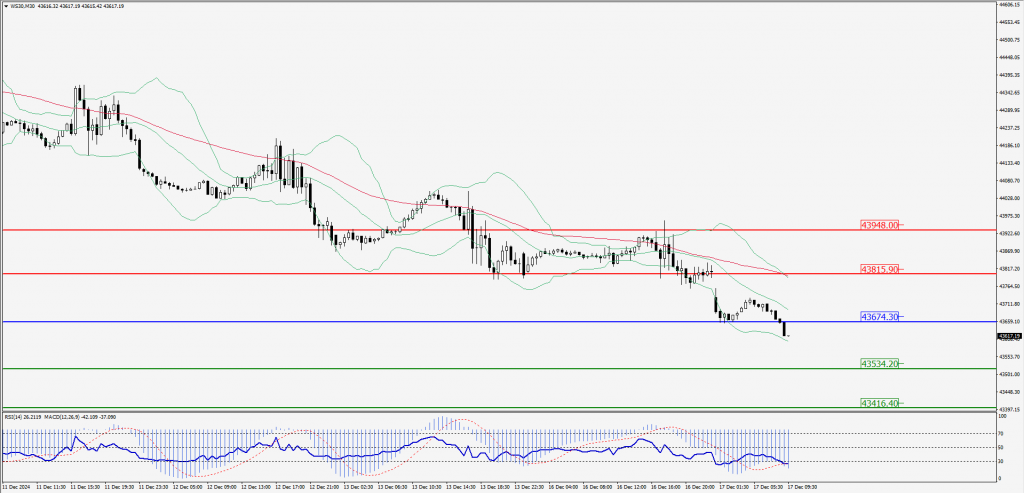
Dow Jones Intraday: Major trend on the downside
Our pivot point is 43,674.30
Preferable Price Action: Take sell positions below the pivot with targets at 43,534.20 & 43,416.40.
Alternative Price Action: Above 43,903.20 looks for further upside to 43,815.90 & 43,948.00.
Comment: RSI is below 50 levels and pairs below its 55MA & 20MA.
Green Lines Indicate Resistance Levels – Red Lines Indicate Support Levels
Light Blue is a Pivot Point – Black represents the price when the report was produced