Market Wrap: Stocks, Bonds, Commodities
Most Asian currencies moved in a tight range on Wednesday, while the dollar remained near three week highs as traders hunkered down in anticipation of more cues on interest rates from the Federal Reserve.
The Dow Jones Industrial Average fail 267.58 points to 43,449.90, the S&P 500 loss 0.39% to 6,050.61 and the Nasdaq Composite down 64.83 points to 20,109.06.
MSCI’s index of Asia-Pacific stocks outside Japan is down 0.29% to 717.25 levels. The Australian index was lower by 0.06% to 8,309.40. Japanese Nikkei Index decrease 0.73% today.
European stocks were mixed on Wednesday, with the Stoxx Europe 50 Index decrease 0.13% to 4,940.45 Germany’s DAX descend 0.33% to 20,246.37, and France’s CAC higher 0.12% to 7,365.70 and U.K.’s FTSE 100 loss 0.81% to 8,195.20.
Benchmark 10-year U.S. Treasury fail as demand for safe assets slipped again, today 10-year bond yields 0.02% to 4.3840.
Iran’s Revolutionary Guards have tightened their grip on the country’s oil industry and control up to half the exports that generate most of Tehran’s revenue and fund its proxies across the Middle East, according to Western officials, security sources and Iranian insiders.
Spot Brent crude oil increase 0.27% to $73.39 per barrel. US West Texas Intermediate crude is decrease 0.31% to $69.86 a barrel.
The yellow metal gold is down 0.01% to 2,661.74 dollars per ounce.
Market Wrap: Forex
The U.S. dollar held steady against the yen and other major rivals on Wednesday as investors waited to see whether the Federal Reserve will deliver a hawkish cut before the Bank of Japan and other central banks meet this week.
Today, the U.S. dollar index measures the Greenback against a trade-weighted basket of six major currencies, which either descend 0.11% to 106.545.
The Euro US Dollar (EUR/USD) is a widely traded is up 0.21% today. This left the pair trading around $1.05110.
The Japanese yen was will move negative against the U.S. dollar on Wednesday. Today USD/JPY is trades pair that decrease 0.03% to the 153.43 level.
Another commodity-related currency negative against the U.S dollar, AUD/USD loss 0.23% to 0.63210, and NZD/USD decrease 0.09% to 0.57460 level.
EUR/USD Intraday: Support level at 1.05040
Our pivot point is at 1.05040
Preferable Price Action: Take buy positions above pivot level with targets at 1.05150 & 1.05240 in extension.
Alternative Price Action: Sell pivot looks for a further downside to 1.04930 & 1.04840.
Comment: RSI is above 50 levels and pairs above its 55MA & 20MA.
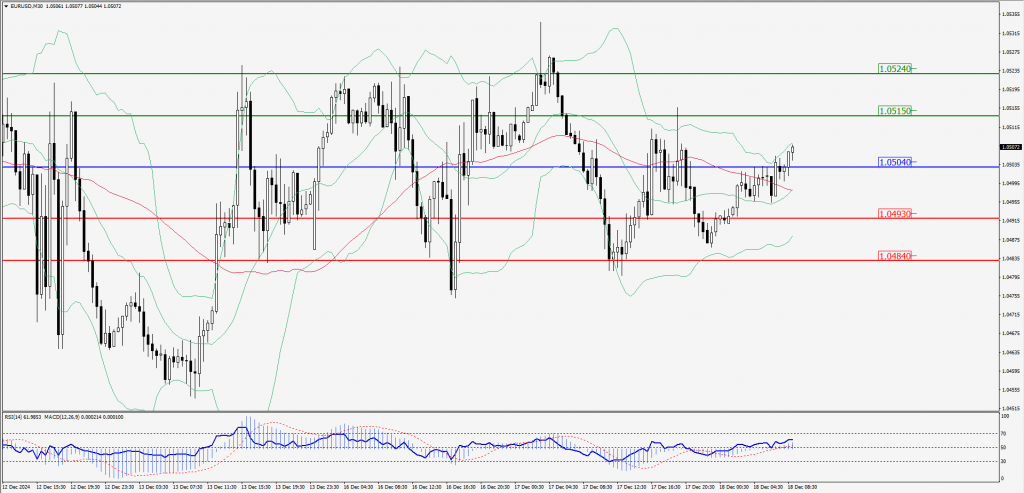
Green Lines Indicate Resistance Levels – Red Lines Indicate Support Levels
Light Blue is a Pivot Point – Black represents the price when the report was produced
GBP/USD Intraday: Trend on the upside
Our pivot point is at 1.27020
Preferable Price Action: Buy positions above pivot with targets at 1.27230 & 1.27410 in extension.
Alternative Price Action: The price below pivot would call for further downside to 1.26820 & 1.26640.
Comment: RSI is above 50 levels and pairs above its 55MA.
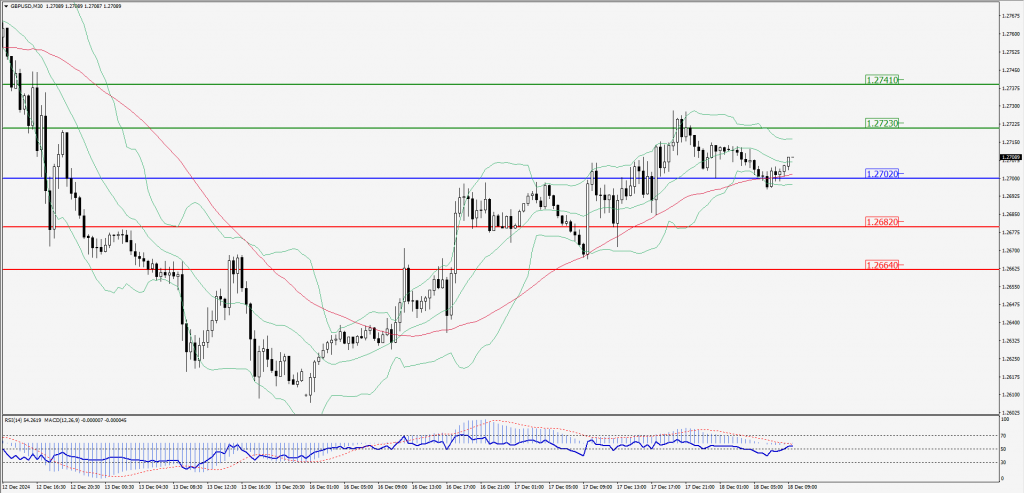
Green Lines Indicate Resistance Levels – Red Lines Indicate Support Levels
Light Blue is a Pivot Point – Black represents the price when the report was produced
USD/JPY Intraday: Trend on the downside
Our pivot point is at 153.500
Preferable Price Action: Sell position below pivot with the target at 153.130 and 152.820 in extension.
Alternative Price Action: The upside breakout of the pivot would call for 153.890 and 154.200.
Comment: MACD is below 50 levels and pairs below its 55MA & 20MA.
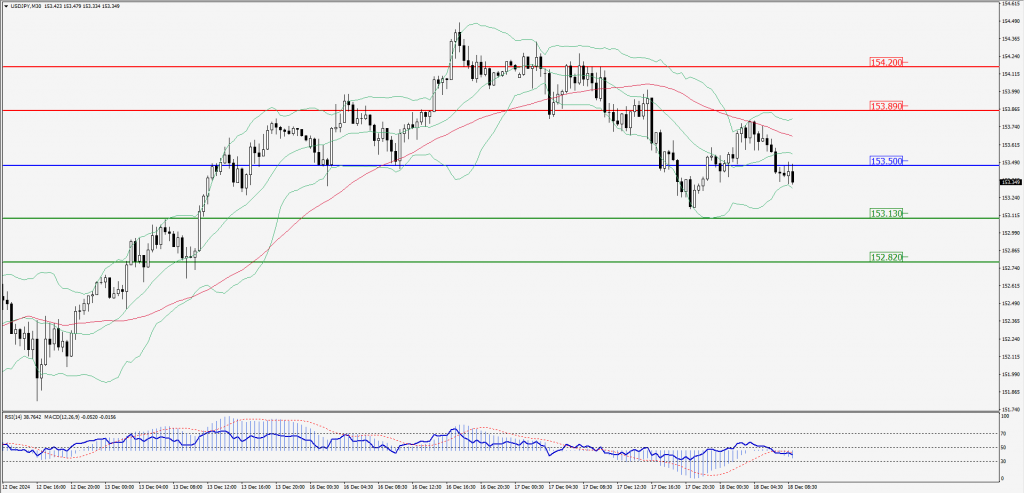
Green Lines Indicate Resistance Levels – Red Lines Indicate Support Levels
Light Blue is a Pivot Point – Black represents the price when the report was produced
AUD/USD Intraday: Major trend on the downside
Our pivot point is at 0.63240
Preferable Price Action: Sell positions below pivot with targets at 0.63080 & 0.62940 in extension.
Alternative Price Action: Above pivot a further upside with 0.63400 & 0.63550 as targets.
Comment: RSI is below 50 levels and pairs below its 55MA & 20MA.
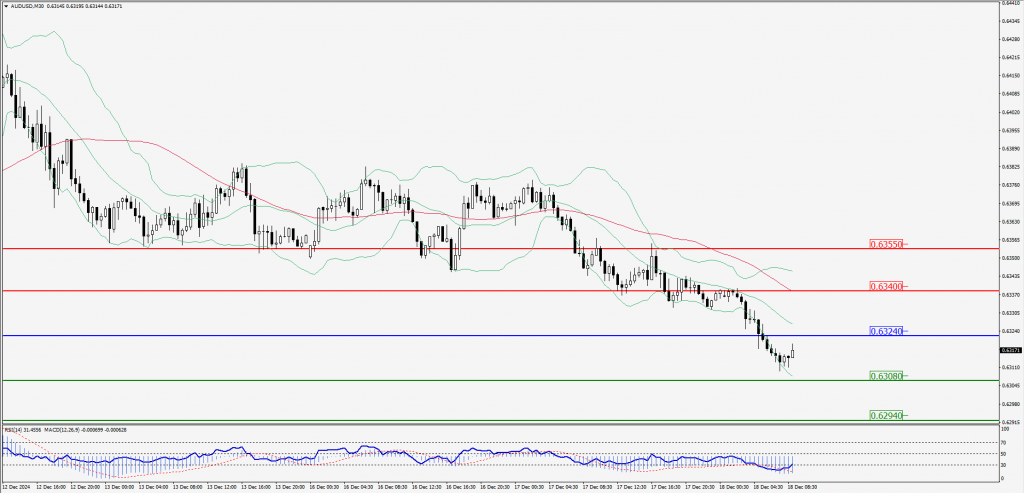
Green Lines Indicate Resistance Levels – Red Lines Indicate Support Levels
Light Blue is a Pivot Point – Black represents the price when the report was produced
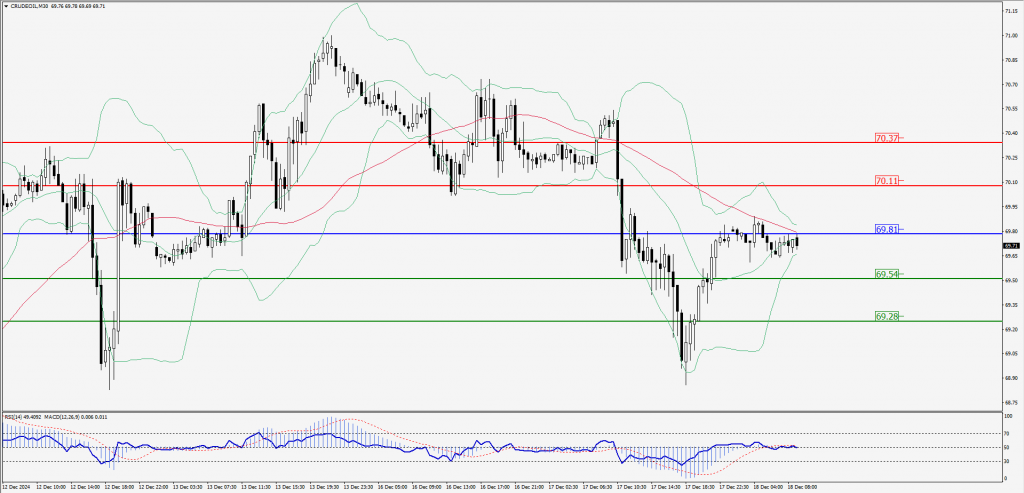
CRUDEOIL Intraday: Trend on the downside
Our pivot point is at 69.81
Preferable Price Action: Below pivot sell oil with 69.54 & 69.28 as targets.
Alternative Price Action: Buy crude above pivot with targets at 70.11 & 70.37 in extension.
Comment: RSI is at below 50 levels and pairs below its 55MA.
Green Lines Indicate Resistance Levels – Red Lines Indicate Support Levels
Light Blue is a Pivot Point – Black represents the price when the report was produced
XAU/USD Intraday: Trend on the downside
Our pivot point is at 2651.80
Preferable Price Action: Further downside to 2639.90 and 2629.80.
Alternative Price Action: If the price gives an upside breakout of a pivot, then the price extends to 2663.90 and 2675.00.
Comment: MACD is below 50 levels.

Green Lines Indicate Resistance Levels – Red Lines Indicate Support Levels
Light Blue is a Pivot Point – Black represents the price when the report was produced
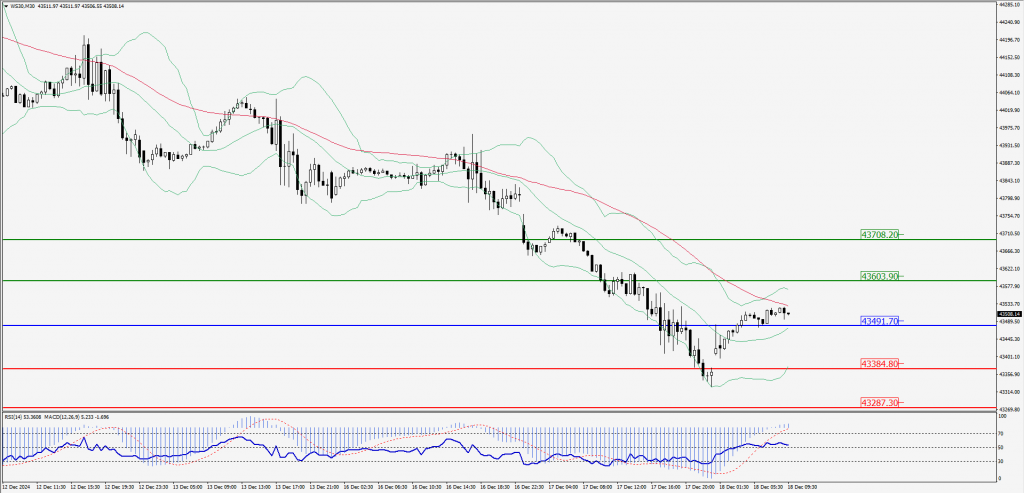
Dow Jones Intraday: Trend on the upside
Our pivot point is 43,491.70
Preferable Price Action: Take buy positions above the pivot with targets at 43,603.90 & 43,708.20.
Alternative Price Action: Below 43,491.70 looks for further downside to 43,384.80 & 43,287.30.
Comment: RSI is above 50 levels and pairs above its 20MA.
Green Lines Indicate Resistance Levels – Red Lines Indicate Support Levels
Light Blue is a Pivot Point – Black represents the price when the report was produced