Market Wrap: Stocks, Bonds, Commodities
Most Asian currencies edged lower on Monday as the dollar remained near a three-week high ahead of a U.S. Federal Reserve meeting this week, while mixed economic data from China spurred concerns over a sluggish economic recovery.
The Dow Jones Industrial Average fail 86.06 points to 43,828.06, the S&P 500 loss 0.01% to 6,051.09 and the Nasdaq Composite up 23.88 points to 19,926.72.
MSCI’s index of Asia-Pacific stocks outside Japan is down 0.99% to 719.38 levels. The Australian index was lower by 0.56% to 8,249.50. Japanese Nikkei Index decrease 0.07% today.
European stocks were mixed on Monday, with the Stoxx Europe 50 Index increase 0.04% to 4,967.45 Germany’s DAX descend 0.10% to 20,405.92, and France’s CAC lower 0.15% to 7,409.57 and U.K.’s FTSE 100 loss 0.14% to 8,300.33.
Benchmark 10-year U.S. Treasury fail as demand for safe assets slipped again, today 10-year bond yields 0.30% to 4.3890.
Oil futures eased from their highest levels in weeks as traders took profit while waiting for a meeting of the Federal Reserve later this week for indication of further rate cuts.
Spot Brent crude oil decrease 0.39% to $74.20 per barrel. US West Texas Intermediate crude is decrease 1.14% to $70.48 a barrel.
The yellow metal gold is down 0.20% to 2,670.55 dollars per ounce.
Market Wrap: Forex
A strong U.S. dollar and high Treasury yields are posing significant challenges for emerging economies, and policymakers have no easy way to counter this powerful one-two punch.
Today, the U.S. dollar index measures the Greenback against a trade-weighted basket of six major currencies, which either descend 0.14% to 106.530.
The Euro US Dollar (EUR/USD) is a widely traded is up 0.13% today. This left the pair trading around $1.05160.
The Japanese yen was will move negative against the U.S. dollar on Monday. Today USD/JPY is trades pair that decrease 0.02% to the 153.61 level.
Another commodity-related currency positive against the U.S dollar, AUD/USD gain 0.13% to 0.63700, and NZD/USD increase 0.30% to 0.57780 level.
EUR/USD Intraday: Trend on the upside
Our pivot point is at 1.05100
Preferable Price Action: Take buy positions above pivot level with targets at 1.05220 & 1.05330 in extension.
Alternative Price Action: Sell pivot looks for a further downside to 1.04980 & 1.04870.
Comment: RSI is above 50 levels and pairs above its 20MA & 55MA.
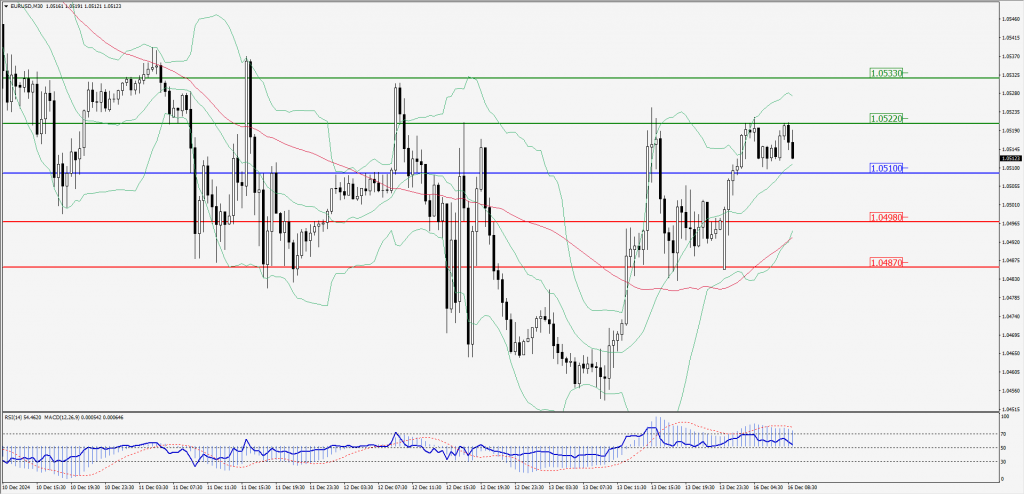
Green Lines Indicate Resistance Levels – Red Lines Indicate Support Levels
Light Blue is a Pivot Point – Black represents the price when the report was produced
GBP/USD Intraday: Trend on the upside
Our pivot point is at 1.26320
Preferable Price Action: Buy positions above pivot with targets at 1.26570 & 1.26800 in extension.
Alternative Price Action: The price below pivot would call for further downside to 1.26060 & 1.25840.
Comment: RSI is above 50 levels and pairs above its 20MA.
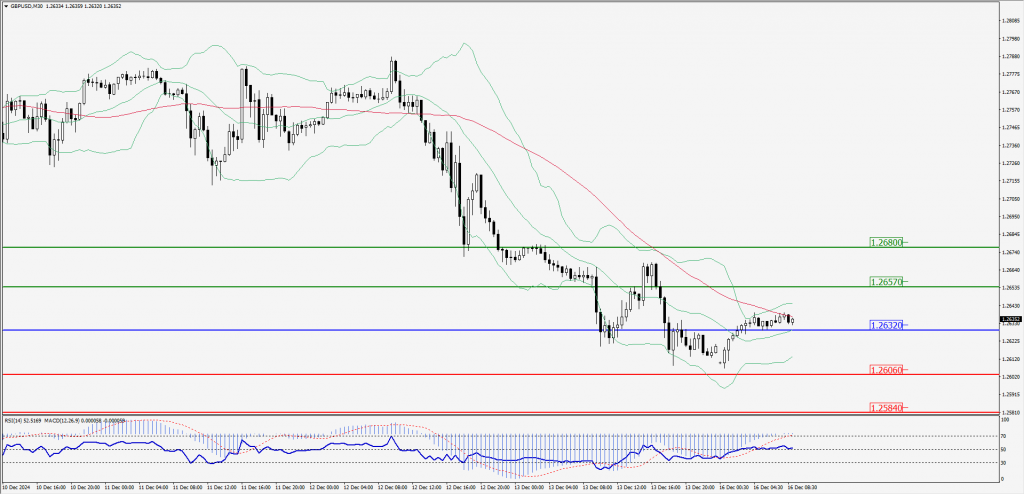
Green Lines Indicate Resistance Levels – Red Lines Indicate Support Levels
Light Blue is a Pivot Point – Black represents the price when the report was produced
USD/JPY Intraday: Trend on the upside
Our pivot point is at 153.640
Preferable Price Action: Buy position above pivot with the target at 154.130 and 154.570 in extension.
Alternative Price Action: The downside breakout of the pivot would call for 152.170 and 152.730.
Comment: MACD is above 50 levels and pairs above its 55MA.
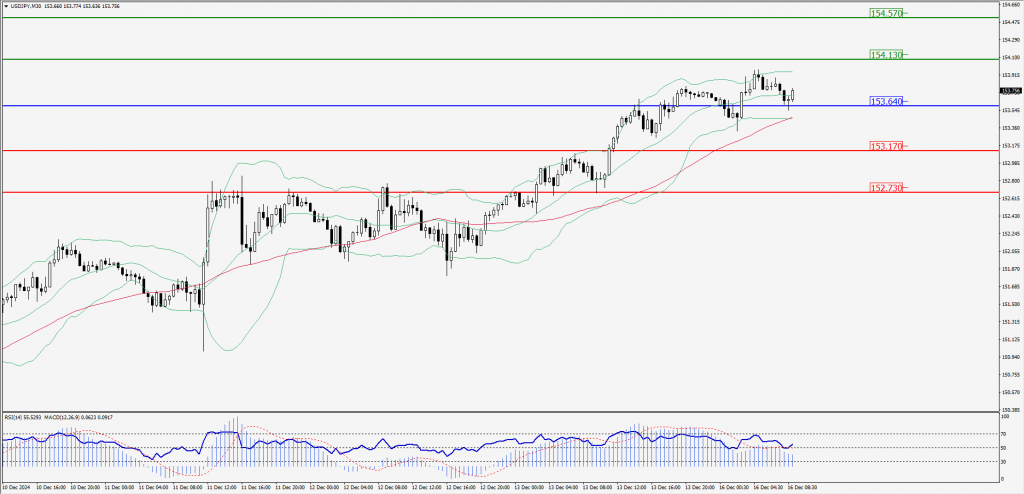
Green Lines Indicate Resistance Levels – Red Lines Indicate Support Levels
Light Blue is a Pivot Point – Black represents the price when the report was produced
AUD/USD Intraday: Trend on the upside
Our pivot point is at 0.63660
Preferable Price Action: Buy positions above pivot with targets at 0.63780 & 0.63880 in extension.
Alternative Price Action: Below pivot a further downside with 0.63540 & 0.63440 as targets.
Comment: RSI is above 50 levels and pairs above its 55MA.
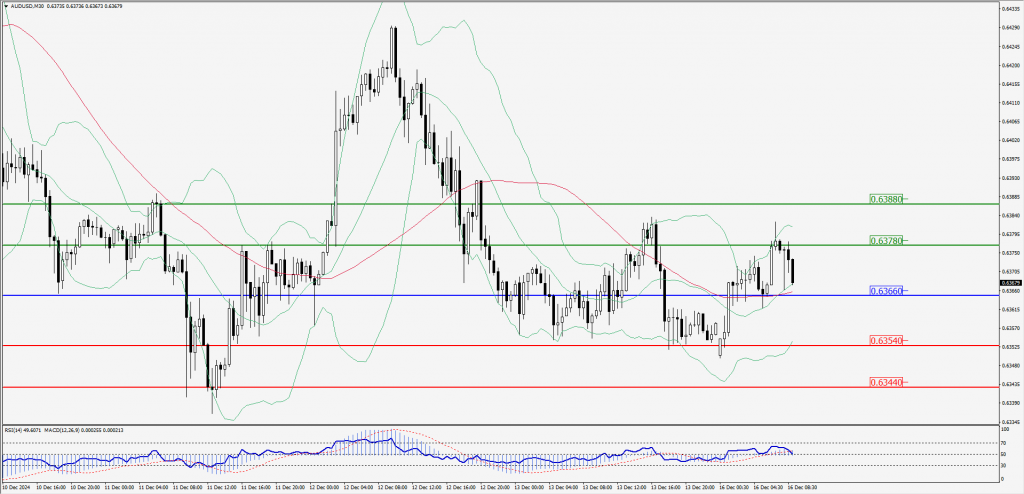
Green Lines Indicate Resistance Levels – Red Lines Indicate Support Levels
Light Blue is a Pivot Point – Black represents the price when the report was produced
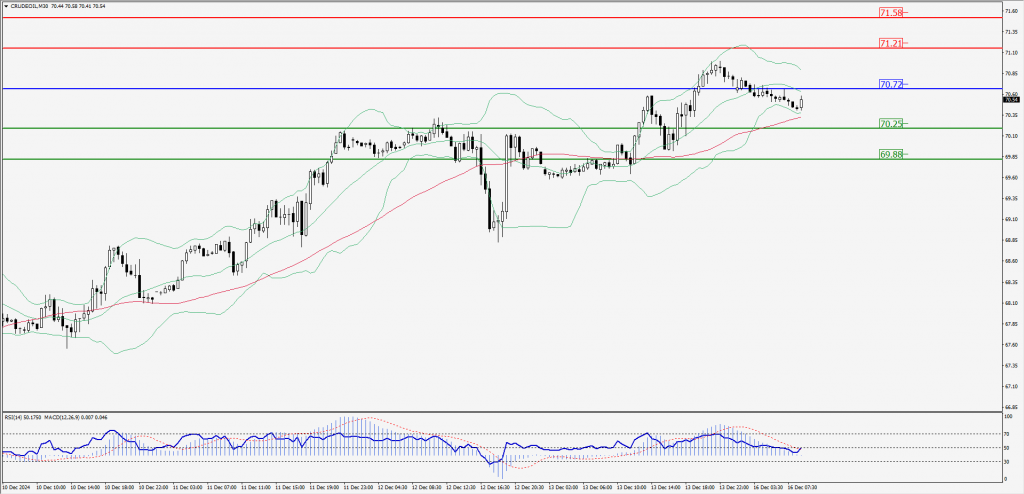
CRUDEOIL Intraday: Trend on the downside
Our pivot point is at 70.72
Preferable Price Action: Below pivot sell oil with 70.25 & 69.88 as targets.
Alternative Price Action: Buy crude above pivot with targets at 71.21 & 71.58 in extension.
Comment: RSI is at below 50 levels and pairs below its 20MA.
Green Lines Indicate Resistance Levels – Red Lines Indicate Support Levels
Light Blue is a Pivot Point – Black represents the price when the report was produced
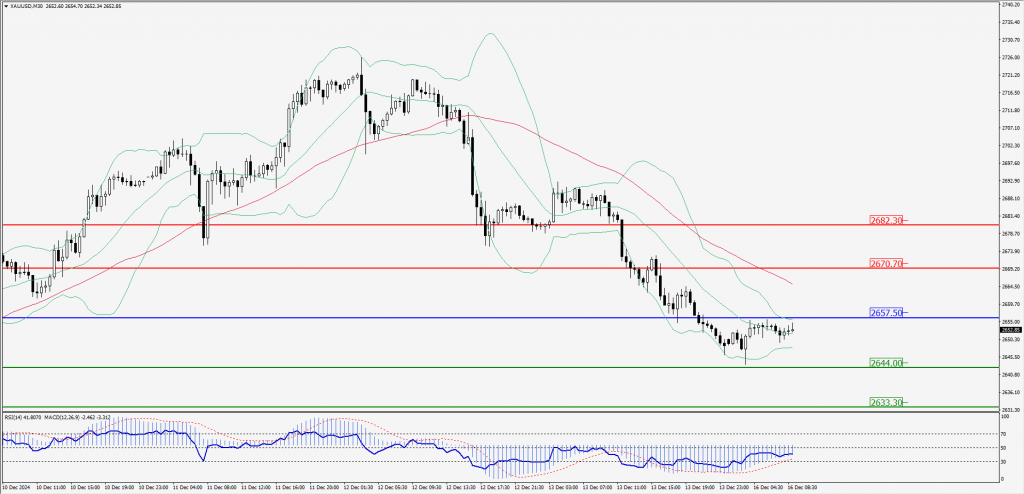
XAU/USD Intraday: Trend on the downside
Our pivot point is at 2657.50
Preferable Price Action: Further downside to 2644.00 and 2633.30.
Alternative Price Action: If the price gives an upside breakout of a pivot, then the price extends to 2670.70 and 2682.30.
Comment: MACD is below 50 levels and pairs below its 55MA.
Green Lines Indicate Resistance Levels – Red Lines Indicate Support Levels
Light Blue is a Pivot Point – Black represents the price when the report was produced
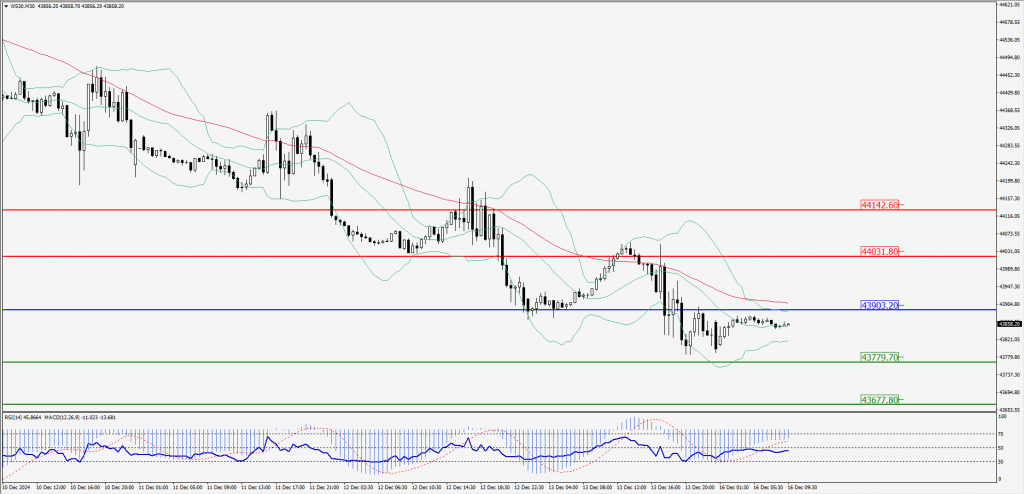
Dow Jones Intraday: Trend on the downside
Our pivot point is 43,903.20
Preferable Price Action: Take sell positions below the pivot with targets at 43,779.70 & 43,677.80.
Alternative Price Action: Above 43,903.20 looks for further upside to 44,031.80 & 44,142.60.
Comment: RSI is below 50 levels and pairs below its 55MA.
Green Lines Indicate Resistance Levels – Red Lines Indicate Support Levels
Light Blue is a Pivot Point – Black represents the price when the report was produced